Exhibit 99.2
| [LOGO] |
Exhibit 99.2
| [LOGO] |
| Disclaimer This presentation contains “forward-looking statements” that are based on management’s beliefs and assumptions and on information currently available to management. These forward-looking statements include, but are not limited to, statements about our plans, objectives, expectations and intentions and other statements contained herein that are not historical facts. When used herein, the words “expects,” “anticipates,” “intends,” “plans,” “believes,” “seeks,” “will,” “should,” “could,” “estimates” and similar expressions are generally intended to identify forward-looking statements. In particular, statements about the markets in which we operate, including growth of our various markets, and statements about our expectations, beliefs, plans, strategies, objectives, prospects, assumptions or future events or performance contained in this presentation are forward-looking statements. Forward-looking statements involve known and unknown risks, uncertainties and other factors that may cause our actual results, performance or achievement to be materially different from any projected results, performance or achievements expressed or implied by the forward-looking statements. Forward-looking statements represent the beliefs and assumptions of DoubleVerify Holdings, Inc. (the “Company”) only as of the date of this presentation, and we undertake no obligation to update or revise, or to publicly announce any update or revision to, any such forward-looking statements, whether as a result of new information, future events or otherwise. As such, the Company’s results may vary from any expectations or goals expressed in, or implied by, the forward-looking statements included in this presentation, possibly to a material degree. We cannot assure you that the assumptions made in preparing any of the forward-looking statements will prove accurate or that any long-term financial or operational goals or targets will be realized. For a discussion of some of the risks, uncertainties and other factors that could cause the Company’s results to differ materially from those expressed in, or implied by, the forward-looking statements included in this presentation, you should refer to the ‘‘Risk Factors’’ and ‘‘Management’s Discussion and Analysis of Financial Condition and Results of Operations’’ sections in the Company’s 10-Q filed with the SEC on November 9, 2021. In addition to disclosing financial results that are determined in accordance with U.S. generally accepted accounting principles (“GAAP”), the Company also discloses in this presentation certain non-GAAP financial measures, including Adjusted EBITDA, Adjusted EBITDA Margin and Adjusted EBITDA less Capital Expenditures. We believe that these non-GAAP financial measures are useful to investors for period-to-period comparisons of the Company’s core business and for understanding and evaluating trends in the Company’s operating results on a consistent basis by excluding items that we do not believe are indicative of the Company’s core operating performance. These non-GAAP financial measures have limitations as analytical tools, and are presented for supplemental purposes and should be considered in addition to, and not in isolation or as substitutes for an analysis of the Company’s results as reported under GAAP. In addition, other companies in the Company’s industry may calculate these non-GAAP financial measures differently than the Company does, limiting their usefulness as a comparative measure. You should compensate for these limitations by relying primarily on the Company’s GAAP results and using the non-GAAP financial measures only supplementally. A reconciliation of these measures to the most directly comparable GAAP measures is included at the end of this presentation. In addition, this presentation contains industry and market data and forecasts that are based on our analysis of multiple sources, including publicly available information, industry publications and surveys, reports from government agencies, reports by market research firms and consultants and our own estimates based on internal company data and management’s knowledge of and experience in the market sectors in which the Company competes. While management believes such information and data are reliable, we have not independently verified the accuracy or completeness of the data contained in these sources and other publicly available information. Accordingly, we make no representations as to the accuracy or completeness of that data nor do we undertake to update such data after the date of this presentation. 2 |
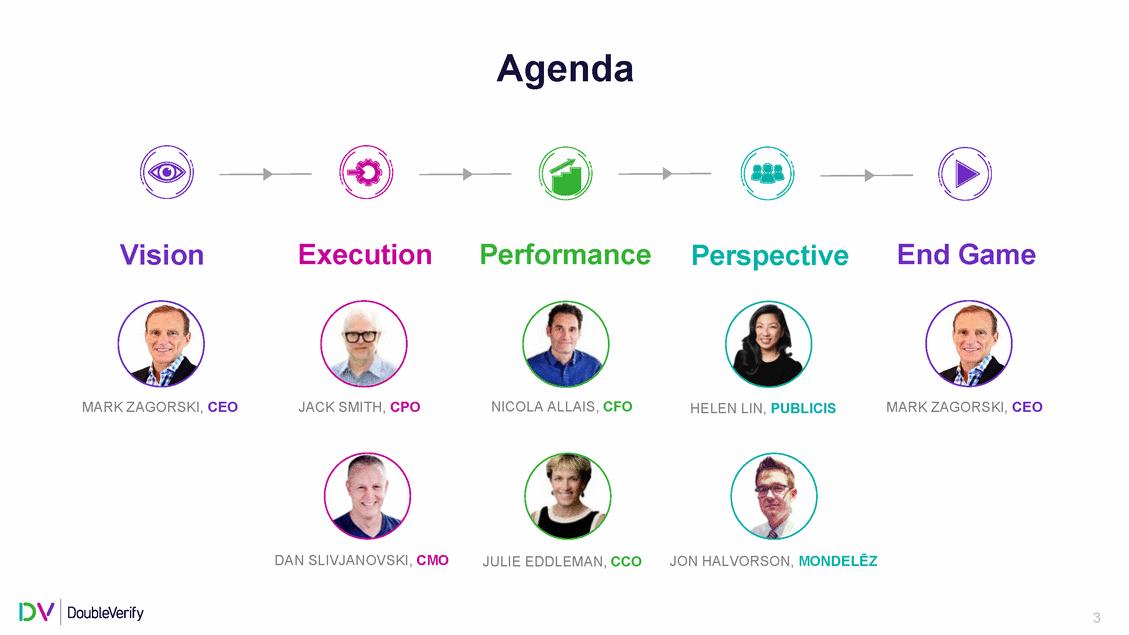
| Agenda Vision Execution Performance End Game Perspective NICOLA ALLAIS, CFO MARK ZAGORSKI, CEO JACK SMITH, CPO MARK ZAGORSKI, CEO HELEN LIN, PUBLICIS DAN SLIVJANOVSKI, CMO JULIE EDDLEMAN, CCO JON HALVORSON, MONDELĒZ 3 |
| VISION Mark Zagorski, CEO 4 |
| VISION 5 tomake the digital advertising ecosystem STRONGER,SAFERAND MORESECURE |
| MISSION 6 todevelopindependent media quality and performance solutionsthatdrive BETTEROUTCOMESFOR ADVERTISERS |
| Industry disruption is challenging measurement and the ability to drive outcomes 7 |
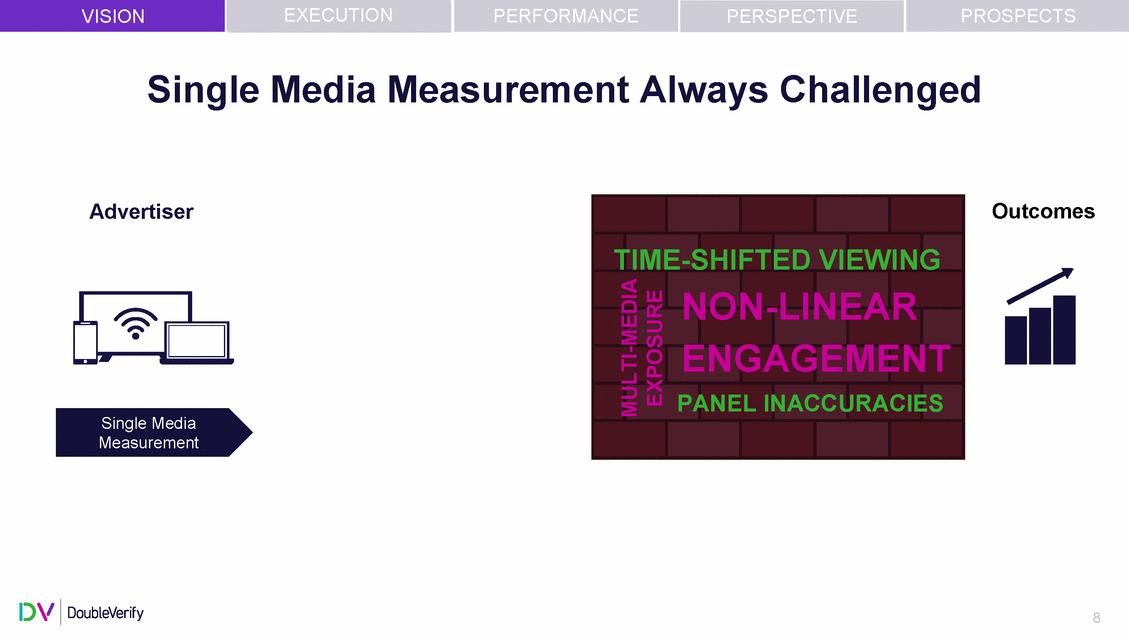
| EXECUTIION PERFORMANCE PROSPECTS VISION PERSPECTIVE Single Media Measurement Always Challenged Outcomes Advertiser NG NON-LINEAR IES Single Media Measurement 8 MULTI-MEDIA EXPOSURE TIME-SHIFTED VIEWI ENGAGEMENT PANEL INACCURAC |
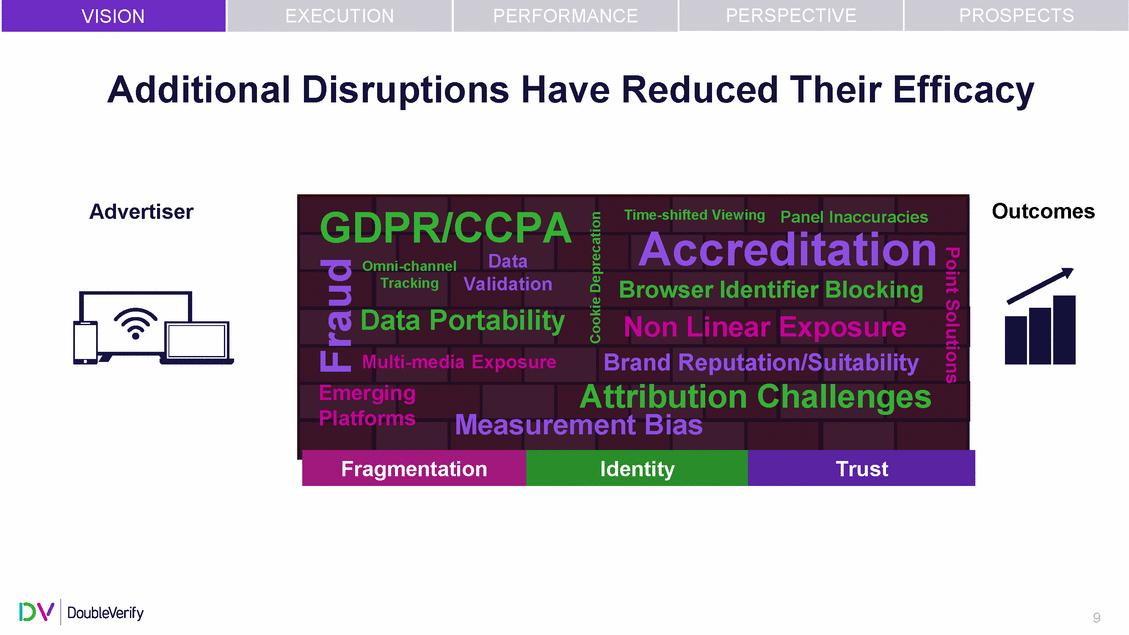
| EXECUTION PERFORMANCE PERSPECTIVE PROSPECTS VISION Additional Disruptions Have Reduced Their Efficacy Outcomes Advertiser GDPR/CCPA hifted View el Inaccuracies EDitVaIEtWioINnG BrowsNerOIdNen-tiLfieIrNBElocAkiRng Portability AttribuPtAioNEnLCINhAaClCleURnAgCeIEsS rging Platforms Audience Currencies 9 Point Solutions Fraud Cookie Deprecation MULTI-MEDIA EXPOSURE Time-s ingPan Omni-channel Data TIAMEc-ScHrIFeTd Tracking Validation Data Non Linear Exposure Multi-med ia Exposure Brand REeNpuGtatAionG/S EuitMabEilitNy T Eme SMingeleaMseudiarem ent Bias Fragmentation Identity Trust |
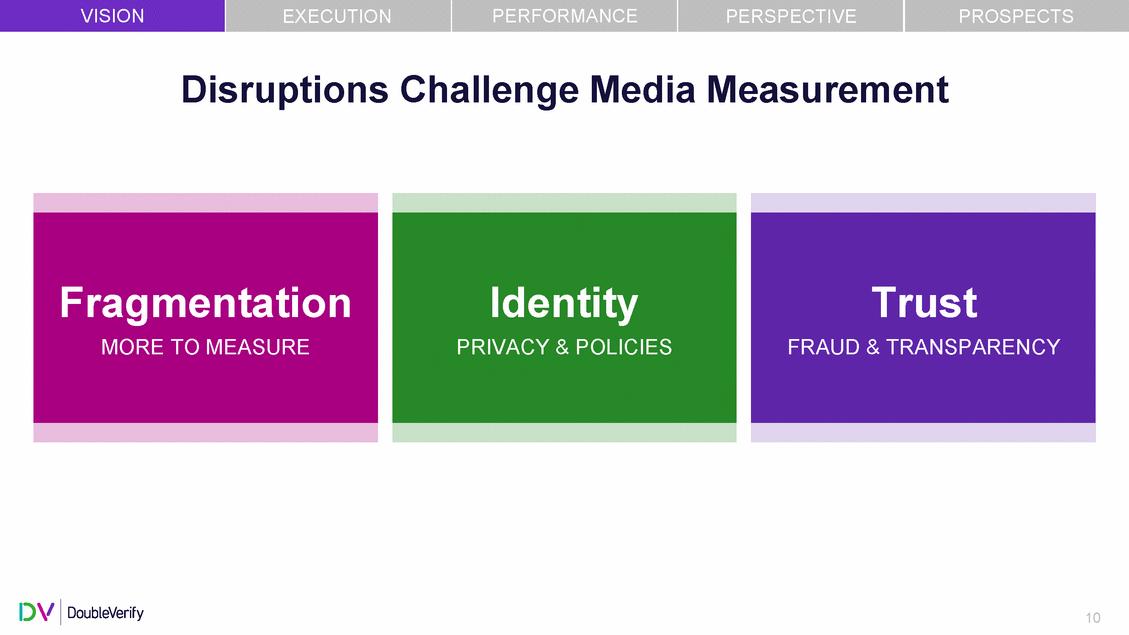
| VISION PERFORMANCE PROSPECTS EXECUTION PERSPECTIVE Disruptions Challenge Media Measurement 10 Trust FRAUD & TRANSPARENCY Identity PRIVACY & POLICIES Fragmentation MORE TO MEASURE |
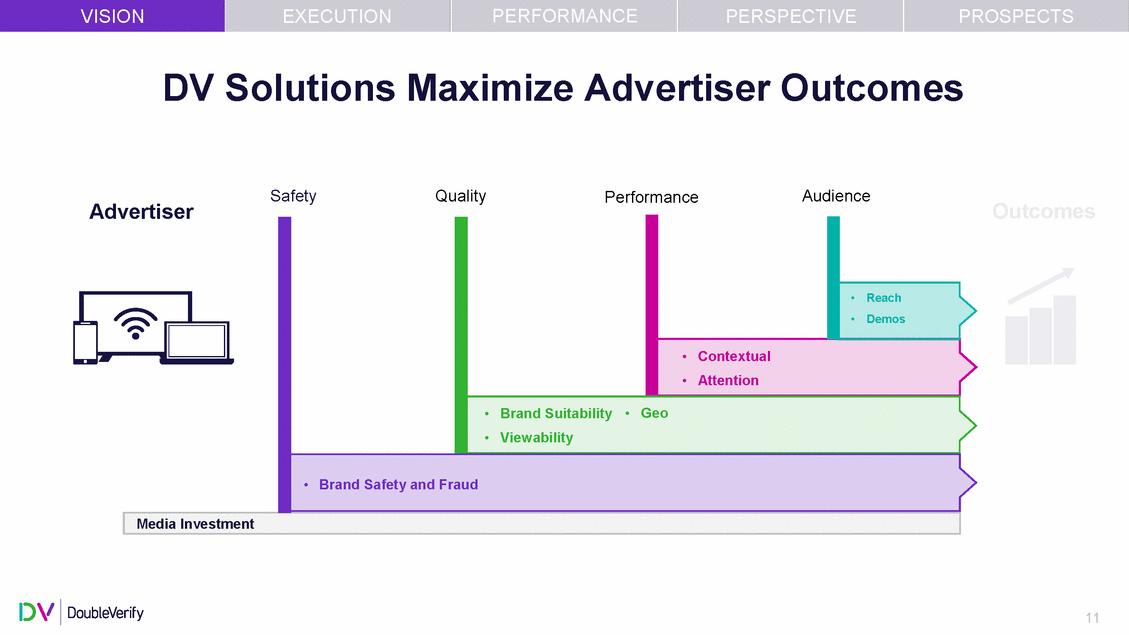
| PERFORMANCE PROSPECTS VISION EXECUTION PERSPECTIVE DV Solutions Maximize Advertiser Outcomes Safety Quality Audience Performance Outcomes Advertiser GDPR/CCPA Time-shift curacies Accreditation Data nnel Validation Browser Identifier Block•inRegach PointSolutions Data Portability ntextual Multi-media Exposure Attribution• AtCtenthionallenges Emerging Brand• BrRand eSuiptabuilityta• Gteioon/Suitability Platforms ndmSeafnettyaatnidoFnraud 11 Non-linear Engagement Fraud Cookie Deprecation ed ViewingPanel Inac Omni-cha Tracking • Demos • Co • Viewability •FBrarag Identity Trust Media Investment |
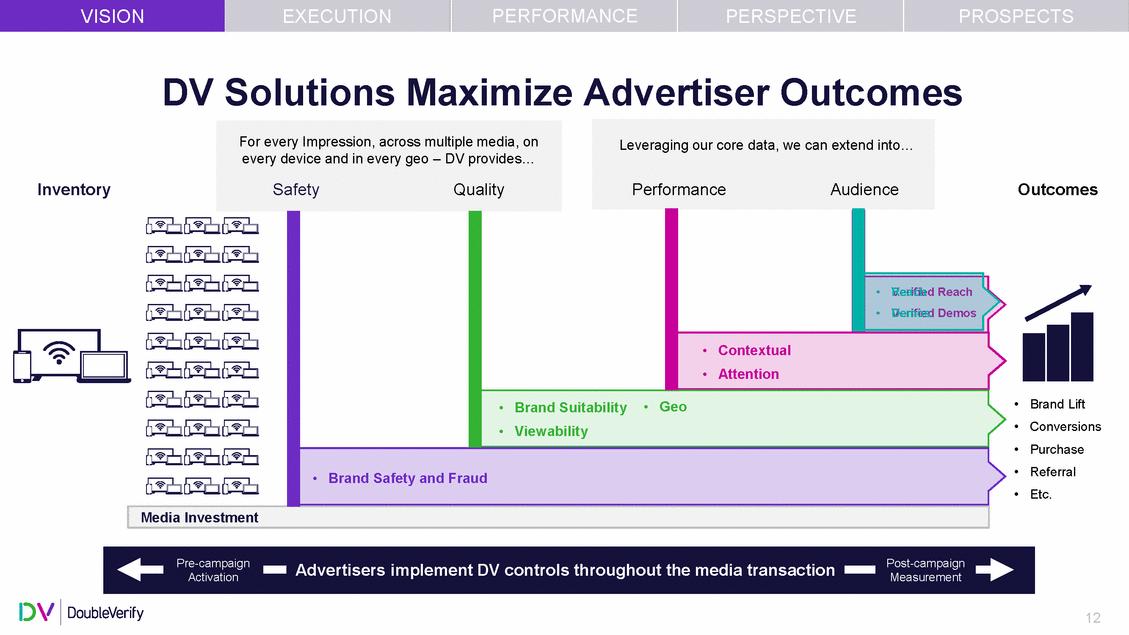
| PERFORMANCE PROSPECTS VISION EXECUTION PERSPECTIVE DV Solutions Maximize Advertiser Outcomes every device and in every geo – DV provides… Inventory Outcomes • • • • • Brand Lift Conversions Purchase Referral Etc. Activation Measurement 12 Pre-campaignAdvertisers implement DV controls throughout the media transactionPost-campaign For every Impression, across multiple media, on SafetyQuality •RVeraicfihed Reach •DVermifoiesd Demos • Contextual • Attention • Brand Suitability• Geo • Viewability • Brand Safety and Fraud Media Investment Leveraging our core data, we can extend into… PerformanceAudience |
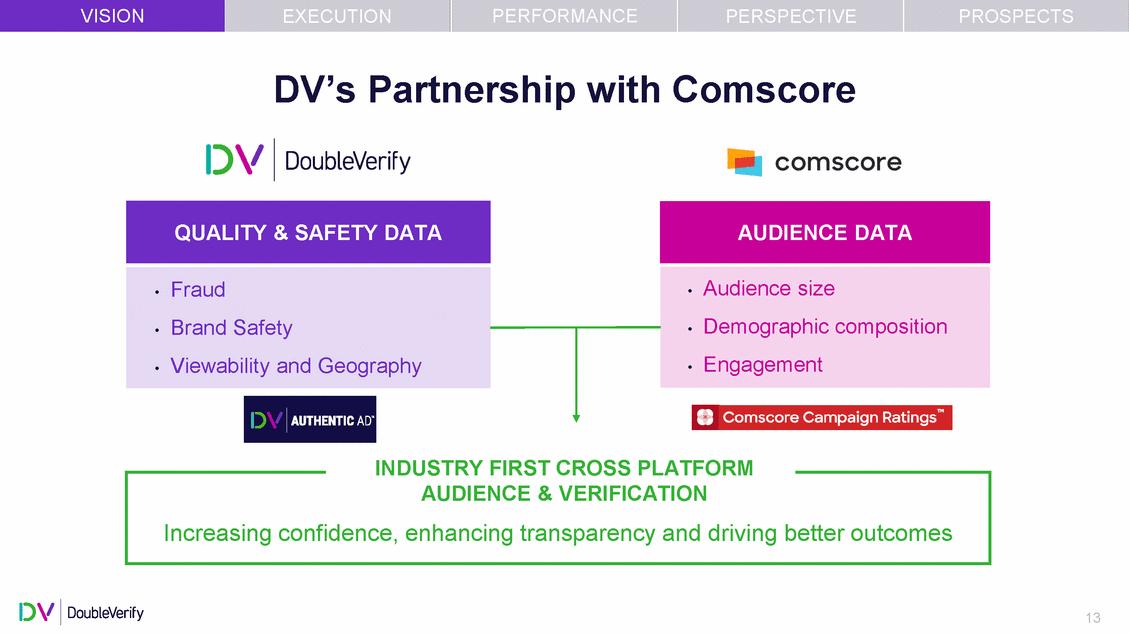
| VISION PERFORMANCE PROSPECTS EXECUTION PERSPECTIVE DV’s Partnership with Comscore INDUSTRY FIRST CROSS PLATFORM 13 AUDIENCE & VERIFICATION Increasing confidence, enhancing transparency and driving better outcomes • Fraud • Brand Safety • Viewability and Geography • Audience size • Demographic composition • Engagement QUALITY & SAFETY DATA AUDIENCE DATA |
| DV is in a unique position to solve measurement challenges 14 |
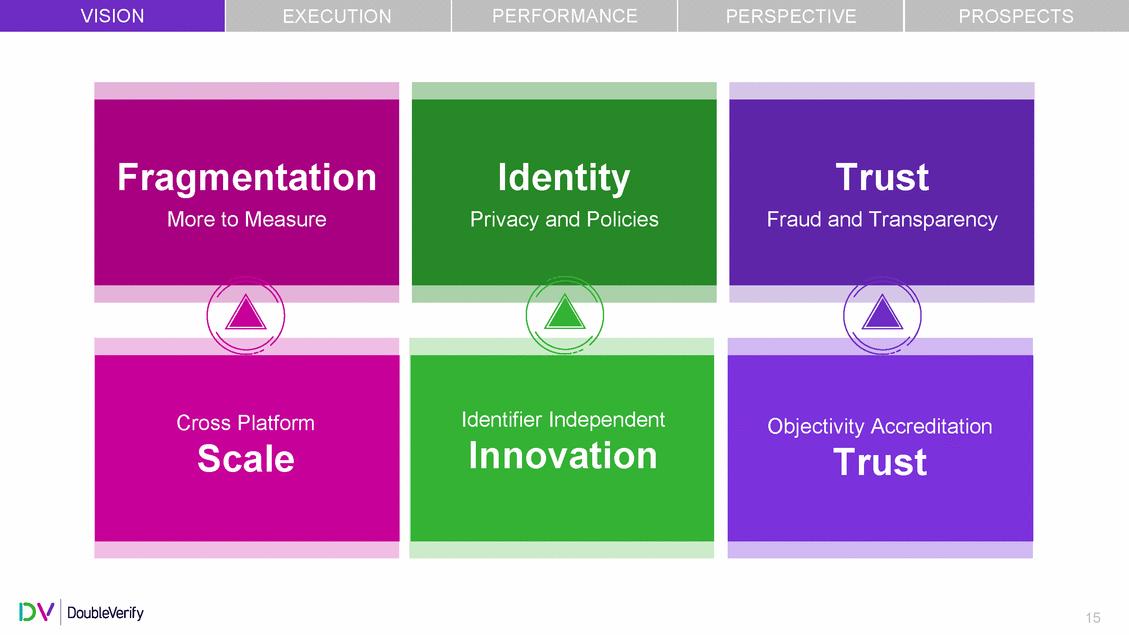
| VISION PERFORMANCE PROSPECTS EXECUTION PERSPECTIVE Innovation 15 Identifier Independent Objectivity Accreditation Trust Cross Platform Scale Trust Fraud and Transparency Identity Privacy and Policies Fragmentation More to Measure |
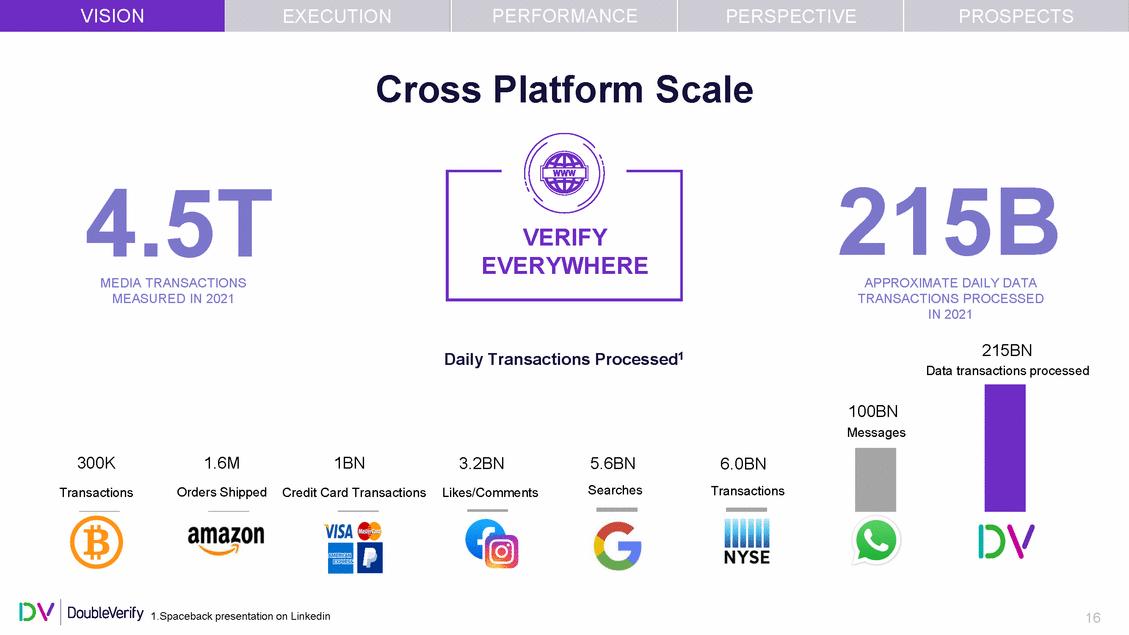
| VISION PERFORMANCE PROSPECTS EXECUTION PERSPECTIVE Cross Platform Scale 215B APPROXIMATE DAILY DATA TRANSACTIONS PROCESSED IN 2021 4.5T MEDIA TRANSACTIONS MEASURED IN 2021 215BN Data transactions processed Daily Transactions Processed1 100BN Messages 300K Transactions 1.6M Orders Shipped 1BN Credit Card Transactions 3.2BN Likes/Comments 5.6BN Searches 6.0BN Transactions 1.Spaceback presentation on Linkedin 16 VERIFY EVERYWHERE |
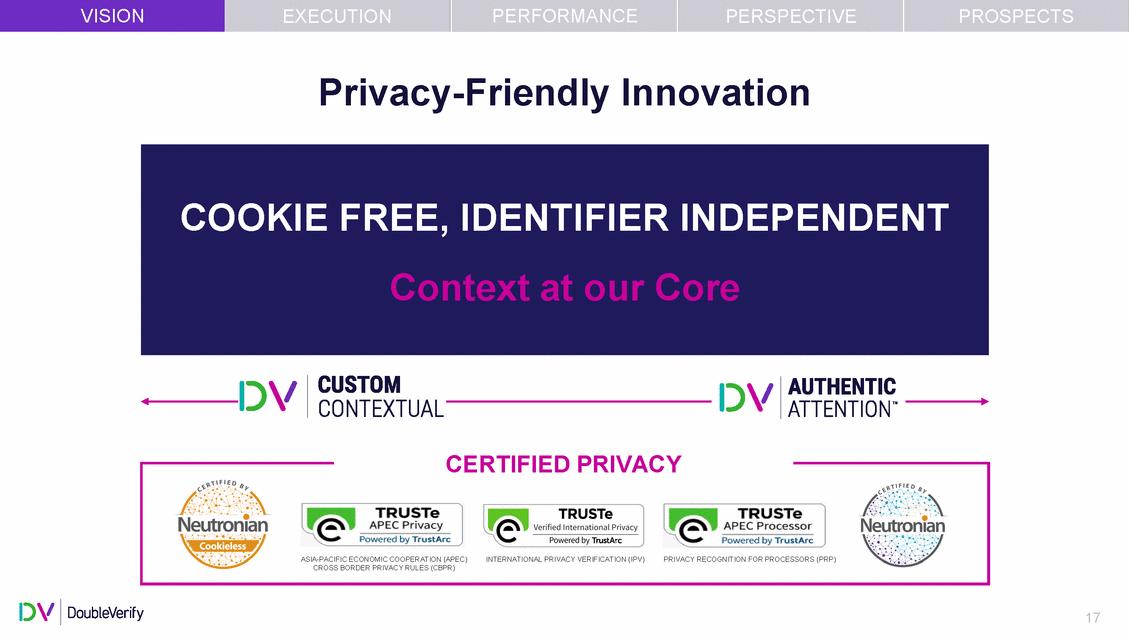
| VISION PERFORMANCE PROSPECTS EXECUTION PERSPECTIVE Privacy-Friendly Innovation CERTIFIED PRIVACY 17 ASIA-PACIFIC ECONOMIC COOPERATION (APEC)INTERNATIONAL PRIVACY VERIFICATION (IPV)PRIVACY RECOGNITION FOR PROCESSORS (PRP) CROSS BORDER PRIVACY RULES (CBPR) COOKIE FREE, IDENTIFIER INDEPENDENT Context at our Core |
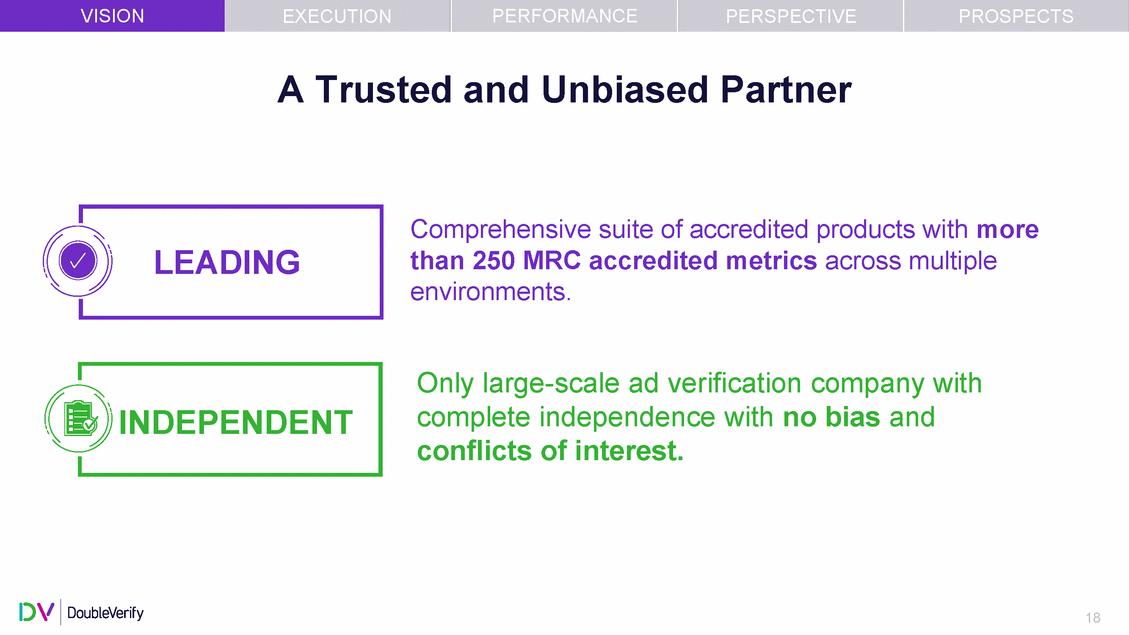
| VISION PERFORMANCE PROSPECTS EXECUTION PERSPECTIVE A Trusted and Unbiased Partner Comprehensive suite of accredited products with more than 250 MRC accredited metrics across multiple environments. Only large-scale ad verification company with complete conflicts independence of interest. with no bias and 18 INDEPENDENT LEADING |
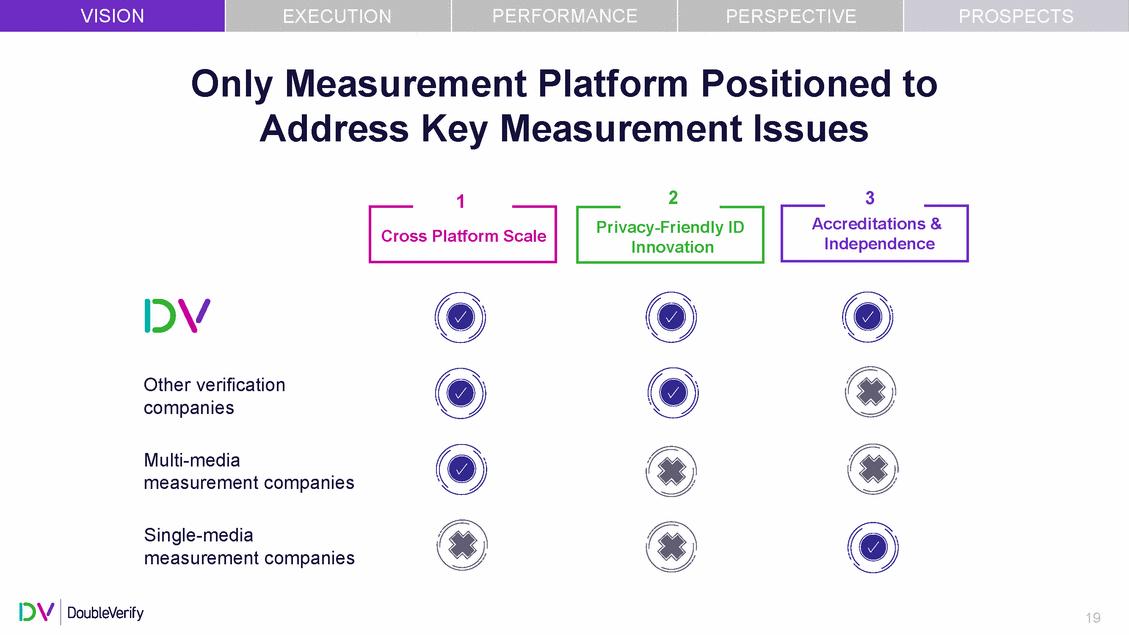
| VISION PERFORMANCE PROSPECTS EXECUTION PERSPECTIVE Only Measurement Platform Positioned to Address Key Measurement Issues 2 3 1 Independence Other verification companies Multi-media measurement companies Single-media measurement companies 19 Accreditations & Privacy-Friendly ID Innovation Cross Platform Scale |
| DV’s unique ability to drive better outcomes is supercharged with pre-campaign activation solutions 20 |
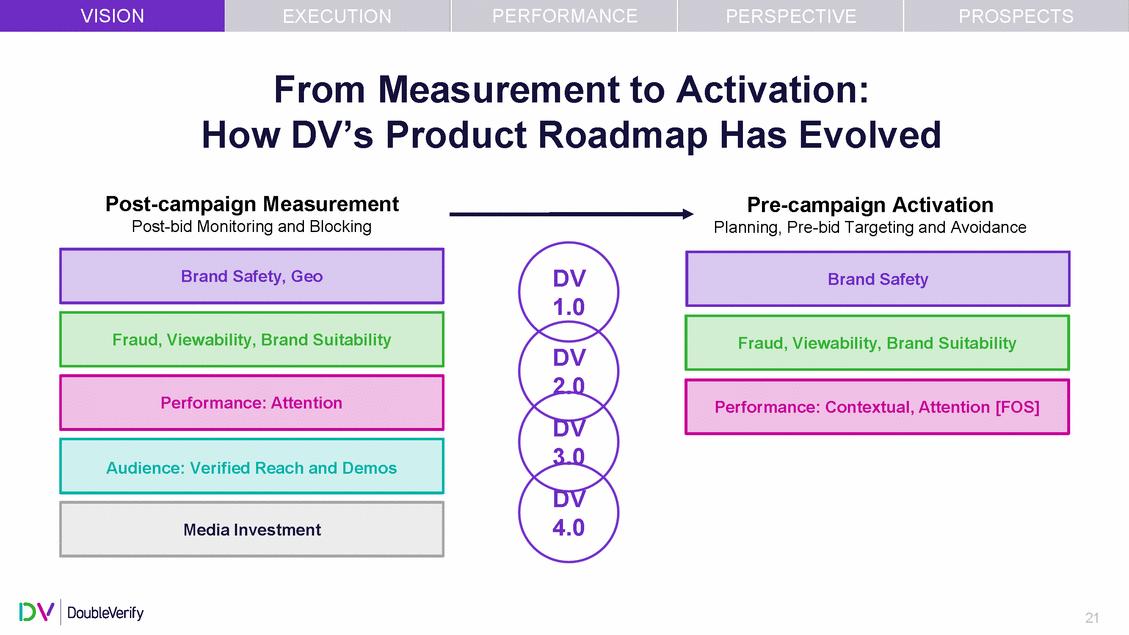
| VISION PERFORMANCE PROSPECTS EXECUTION PERSPECTIVE From Measurement to Activation: How DV’s Product Roadmap Has Evolved Post-campaign Measurement Post-bid Monitoring and Blocking Pre-campaign Activation Planning, Pre-bid Targeting and Avoidance DV 1.0 DV 2.0 DV 3.0 DV 4.0 21 Media Investment Audience: Verified Reach and Demos Performance: Contextual, Attention [FOS] Performance: Attention Fraud, Viewability, Brand Suitability Fraud, Viewability, Brand Suitability Brand Safety Brand Safety, Geo |
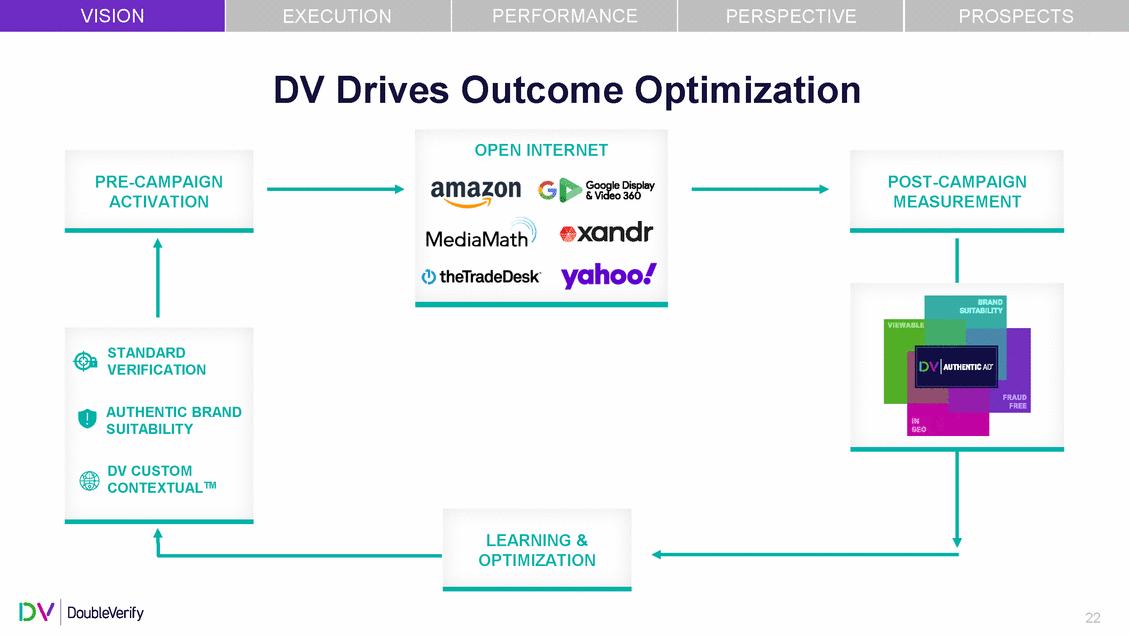
| VISION PERFORMANCE PROSPECTS EXECUTION PERSPECTIVE DV Drives Outcome OPEN INTERNET Optimization PRE-CAMPAIGN ACTIVATION POST-CAMPAIGN MEASUREMENT STANDARD VERIFICATION AUTHENTIC BRAND SUITABILITY DV CUSTOM CONTEXTUALTM LEARNING & OPTIMIZATION 22 |
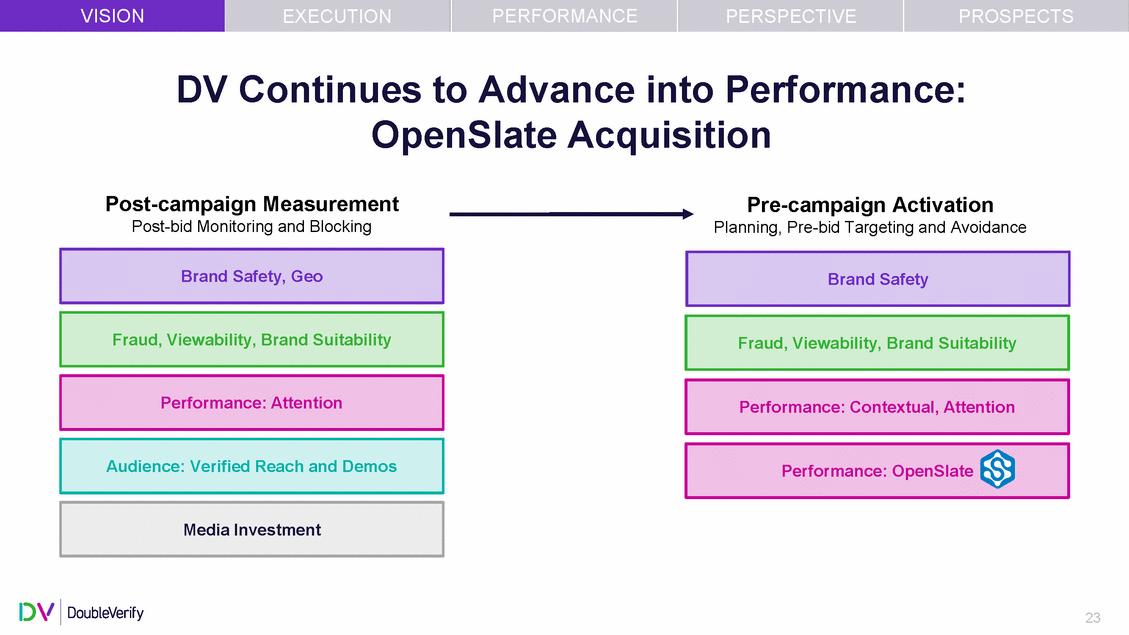
| VISION PERFORMANCE PROSPECTS EXECUTION PERSPECTIVE DV Continues to Advance into Performance: OpenSlate Acquisition Post-campaign Measurement Post-bid Monitoring and Blocking Pre-campaign Activation Planning, Pre-bid Targeting and Avoidance 23 Media Investment Performance: OpenSlate Audience: Verified Reach and Demos Performance: Contextual, Attention Performance: Attention Fraud, Viewability, Brand Suitability Fraud, Viewability, Brand Suitability Brand Safety Brand Safety, Geo |
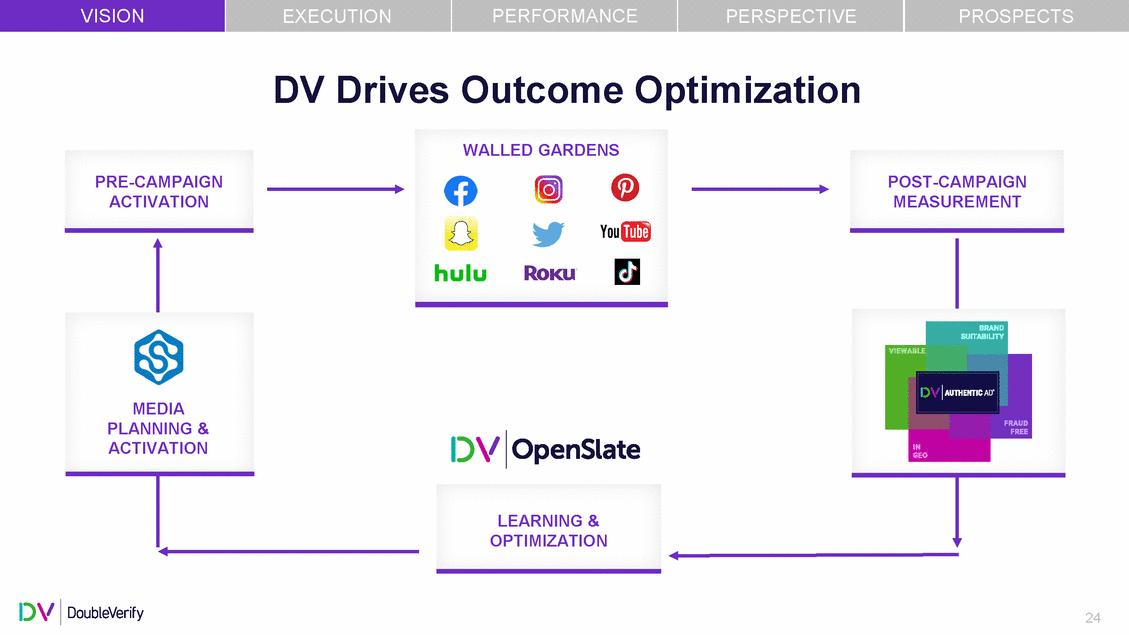
| VISION PERFORMANCE PROSPECTS EXECUTION PERSPECTIVE DV Drives Outcome WALLED GARDENS Optimization PRE-CAMPAIGN ACTIVATION POST-CAMPAIGN MEASUREMENT MEDIA PLANNING & ACTIVATION LEARNING & OPTIMIZATION 24 |
| DV is essential in driving outcomes 25 |
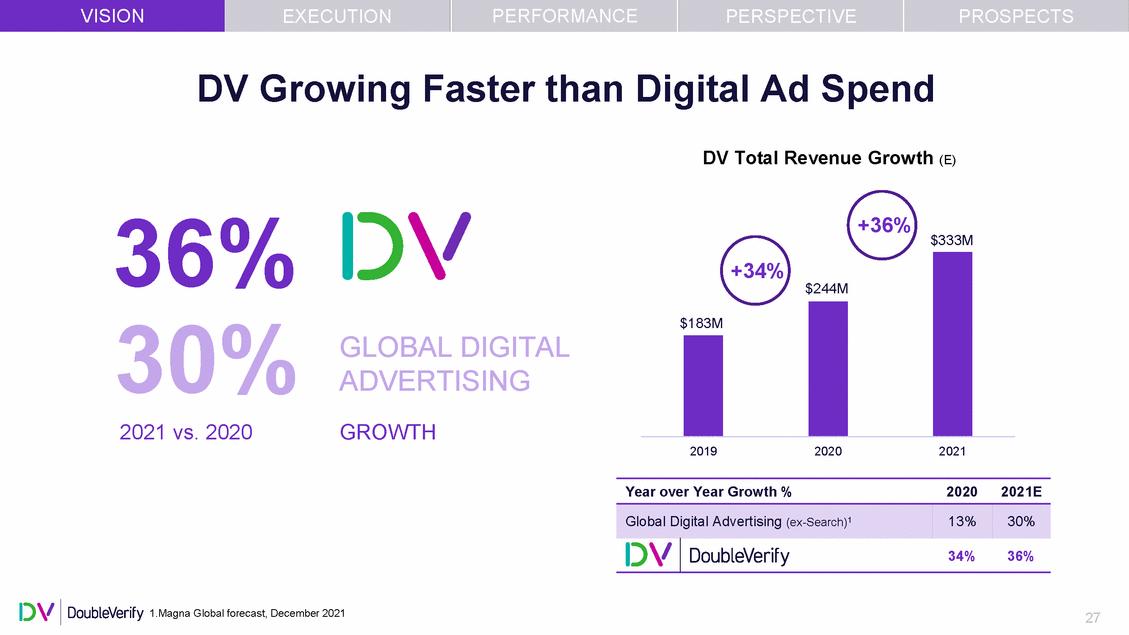
| As a result, DV is growing faster… 26 |
| VISION PERFORMANCE PROSPECTS EXECUTION PERSPECTIVE DV Growing Faster than Digital Ad Spend DV Total Revenue Growth (E) 36% 30% 2021 vs. 2020 +36% $333M $244M GLOBAL DIGITAL ADVERTISING GROWTH 2019 2020 2021 Year over Year Growth % 2020 2021E 1.Magna Global forecast, December 2021 27 Global Digital Advertising (ex-Search)113%30% 34%36% +34% $183M |
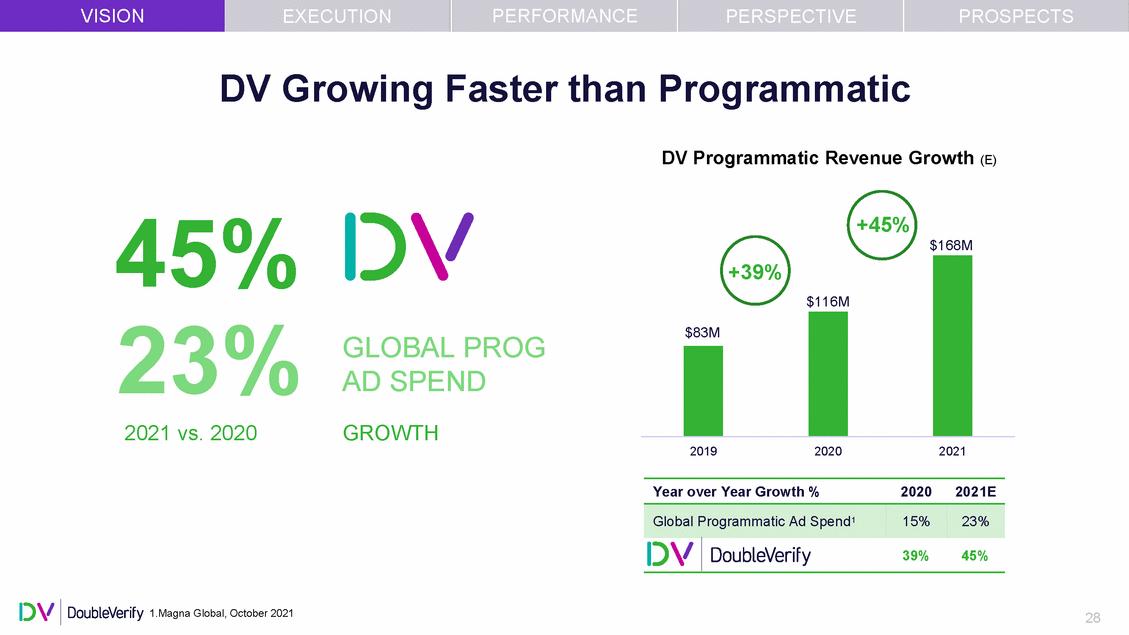
| VISION PERFORMANCE PROSPECTS EXECUTION PERSPECTIVE DV Growing Faster than Programmatic DV Programmatic Revenue Growth (E) 45% 23% 2021 vs. 2020 +45% $168M GLOBAL PROG AD SPEND GROWTH 2019 2020 2021 Year over Year Growth % 2020 2021E 1.Magna Global, October 2021 28 Global Programmatic Ad Spend1 15%23% 39%45% +39% $116M $83M |
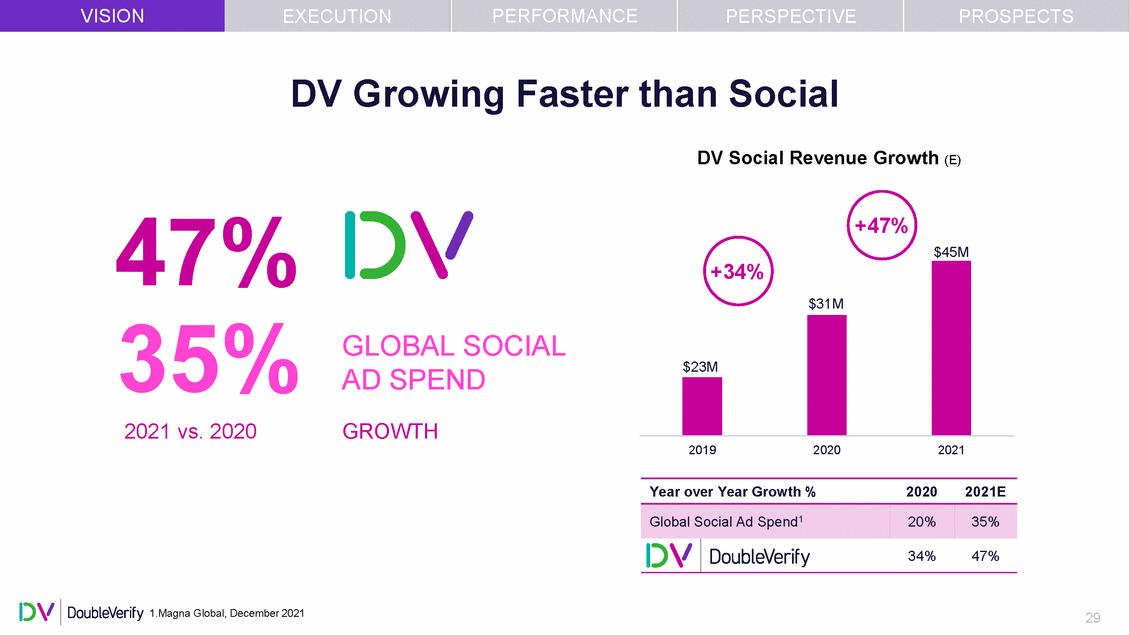
| VISION PERFORMANCE PROSPECTS EXECUTION PERSPECTIVE DV Growing Faster than Social DV Social Revenue Growth (E) 47% 35% 2021 vs. 2020 +47% $45M GLOBAL SOCIAL AD SPEND GROWTH 2019 2020 2021 Year over Year Growth % 2020 2021E 1.Magna Global, December 2021 29 Global Social Ad Spend120%35% 34%47% +34% $31M $23M |
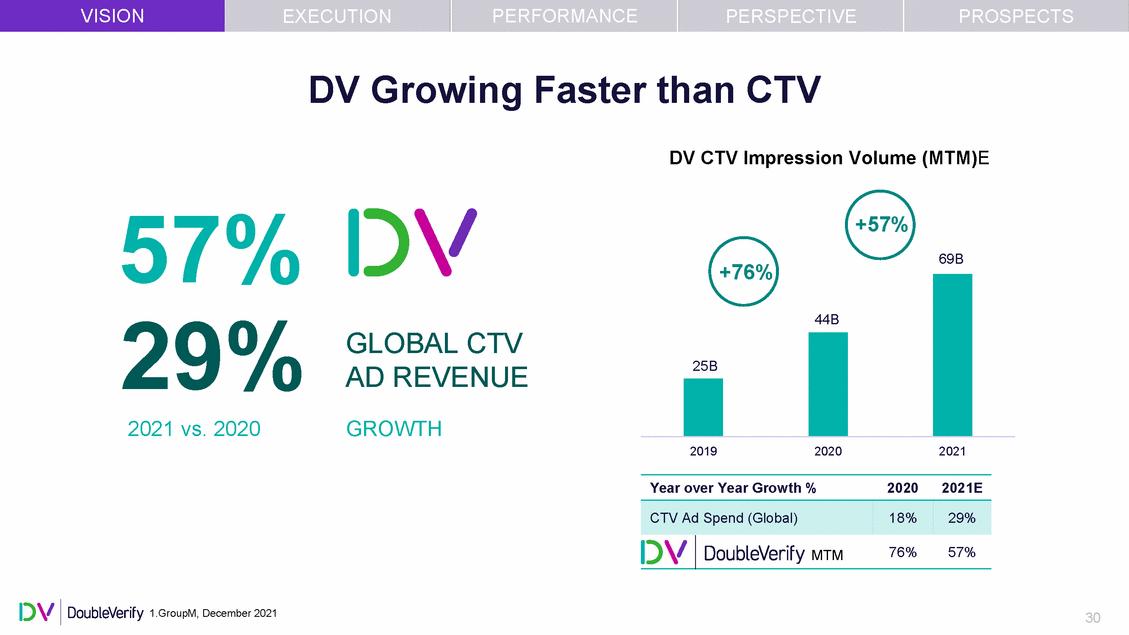
| VISION PERFORMANCE PROSPECTS EXECUTION PERSPECTIVE DV Growing Faster than CTV DV CTV Impression Volume (MTM)E 57% 29% 2021 vs. 2020 +57% 69B +76% GLOBAL CTV AD REVENUE GROWTH 2019 2020 2021 Year over Year Growth % 2020 2021E 1.GroupM, December 2021 30 CTV Ad Spend (Global)18%29% MTM76%57% 44B 25B |
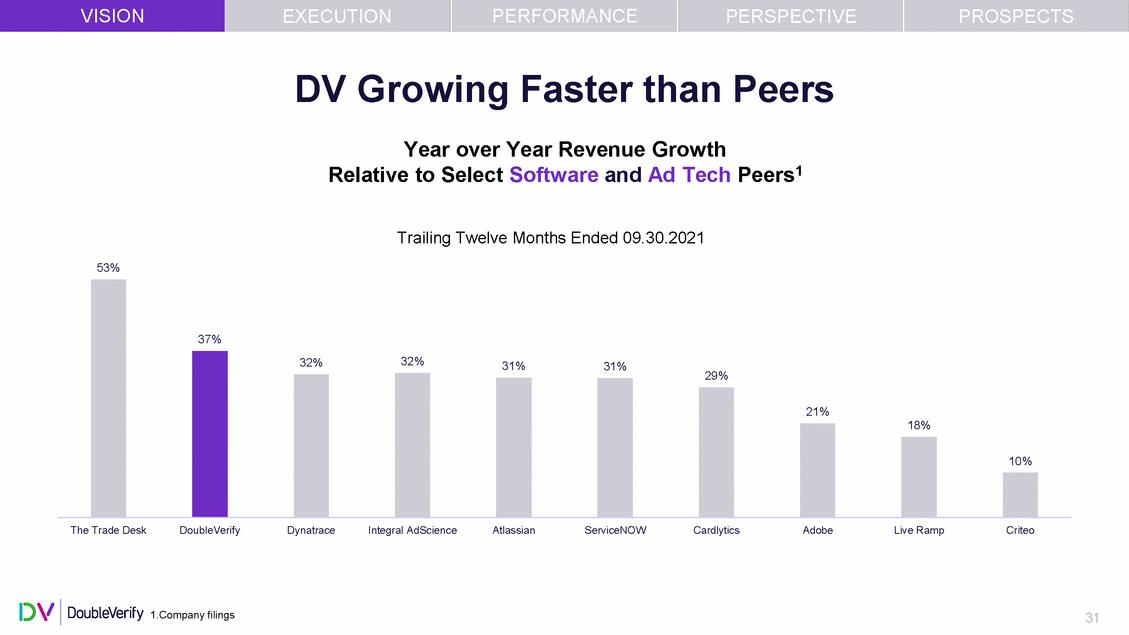
| VISION PERFORMANCE PROSPECTS EXECUTION PERSPECTIVE DV Growing Faster than Peers Year over Year Revenue Growth Relative to Select Software and Ad Tech Peers1 Trailing Twelve Months Ended 09.30.2021 53% 37% 32% 32% 31% 31% 29% 21% 18% 10% The Trade Desk DoubleVerify Dynatrace Integral AdScience Atlassian ServiceNOW Cardlytics Adobe Live Ramp Criteo 1.Company filings 31 |
| With a runway for future growth 32 |
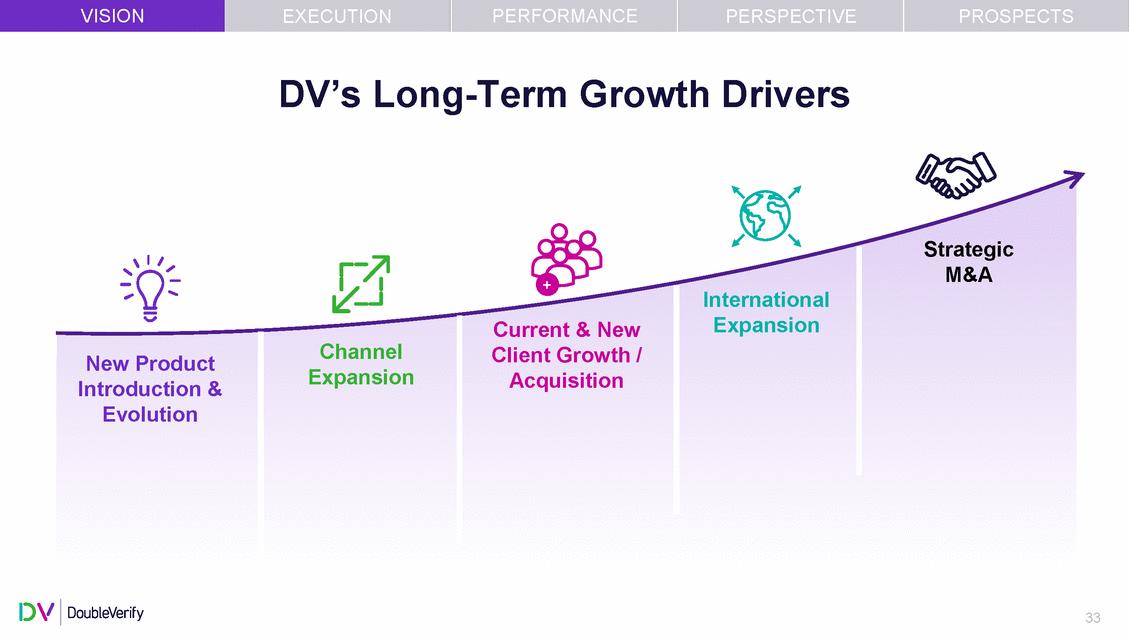
| VISION PERFORMANCE PROSPECTS EXECUTION PERSPECTIVE DV’s Long-Term Growth Drivers Strategic M&A + International Expansion Current & New Channel Expansion Client Growth / Acquisition New Product Introduction & Evolution 33 |
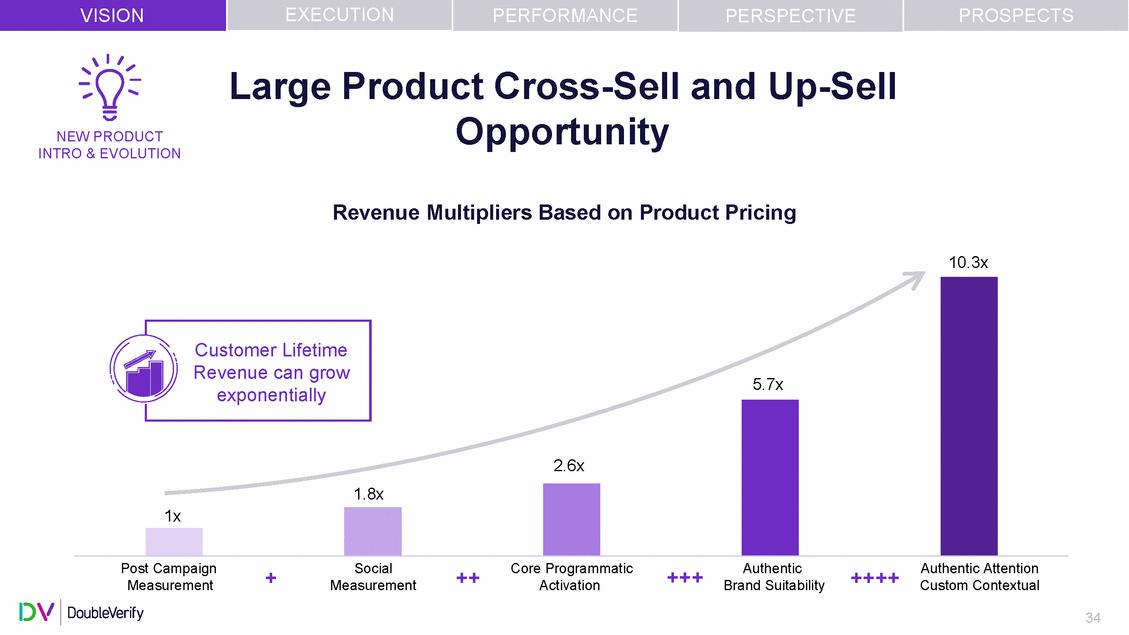
| EXECUTION VISION PERFORMANCE PERSPECTIVE PROSPECTS Large Product Cross-Sell and Up-Sell Opportunity NEW PRODUCT INTRO & EVOLUTION Revenue Multipliers Based on Product Pricing 10.3x Post Campaign Measurement Social Measurement Core Programmatic Activation Authentic Brand Suitability Authentic Attention Custom Contextual +++ + ++ ++++ 34 5.7x 2.6x 1.8x 1x Customer Lifetime Revenue can grow exponentially |
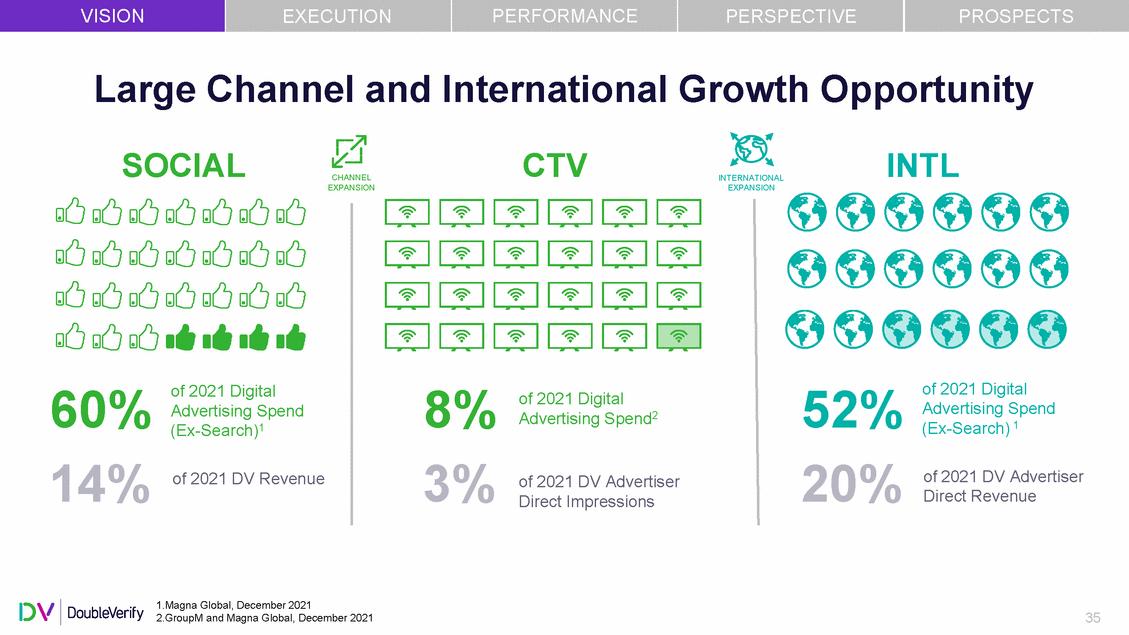
| VISION PERFORMANCE PROSPECTS EXECUTION PERSPECTIVE Large Channel and International Growth Opportunity SOCIAL CTV INTL CHANNEL EXPANSION INTERNATIONAL EXPANSION of 2021 Digital Advertising Spend (Ex-Search) 1 of 2021 Digital 52% 20% Advertising Spend2 (Ex-Search)1 14% 3% of 2021 DV Advertiser Direct Revenue of 2021 DV Revenue of 2021 DV Advertiser Direct Impressions 1.Magna Global, December 2021 2.GroupM and Magna Global, December 2021 35 |
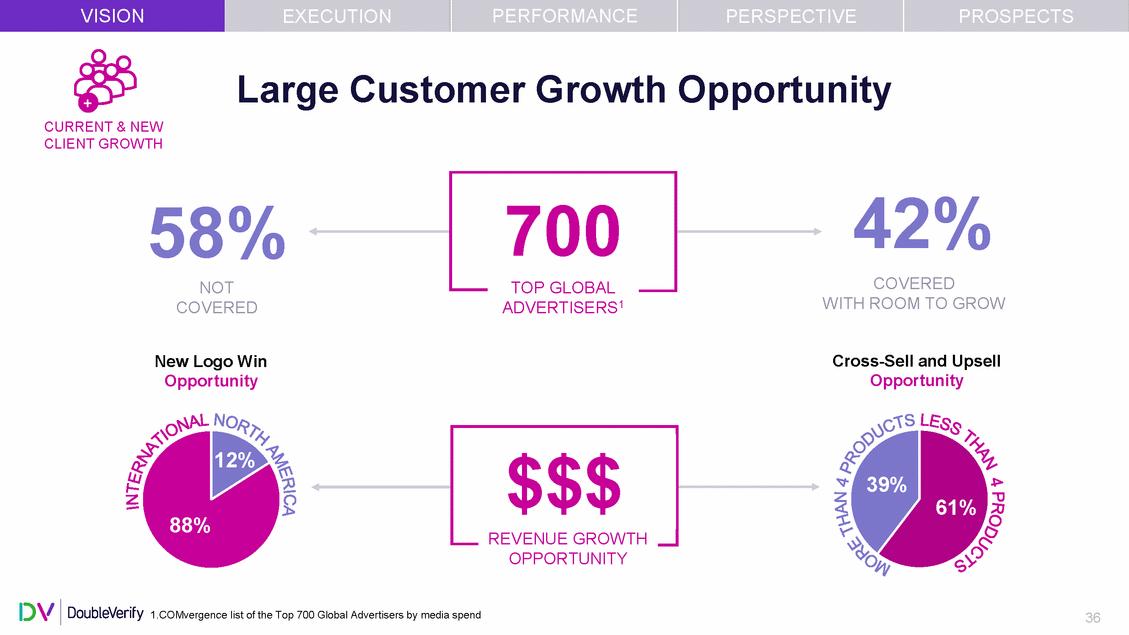
| VISION PERFORMANCE PROSPECTS EXECUTION PERSPECTIVE Large Customer Growth Opportunity + CURRENT & NEW CLIENT GROWTH 42% COVERED WITH ROOM TO GROW 58% NOT COVERED ADVERTISERS1 Cross-Sell and Upsell Opportunity New Logo Win Opportunity 12% 39% 61% 88% OPPORTUNITY 1.COMvergence list of the Top 700 Global Advertisers by media spend 36 $$$ REVENUE GROWTH 700 TOP GLOBAL |
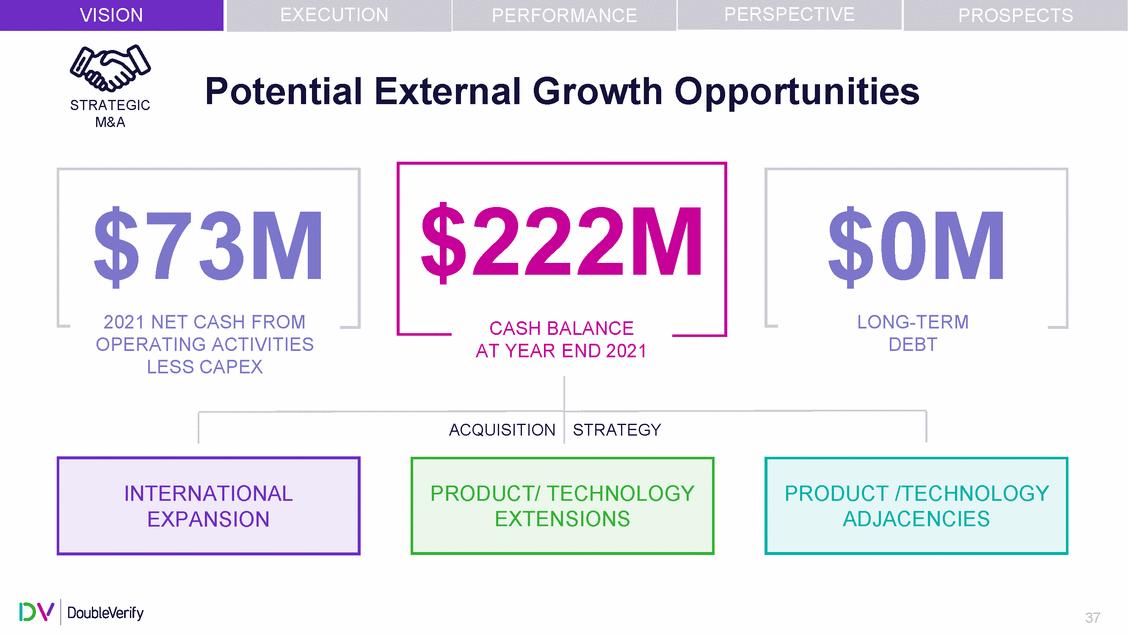
| VISION EXECUTION PERSPECTIVE PERFORMANCE PROSPECTS Potential External Growth Opportunities STRATEGIC M&A $222M $73M 2021 NET CASH FROM OPERATING ACTIVITIES LESS CAPEX DEBT AT YEAR END 2021 37 PRODUCT /TECHNOLOGY ADJACENCIES PRODUCT/ TECHNOLOGY EXTENSIONS INTERNATIONAL EXPANSION ACQUISITION STRATEGY $0M LONG-TERM CASH BALANCE |
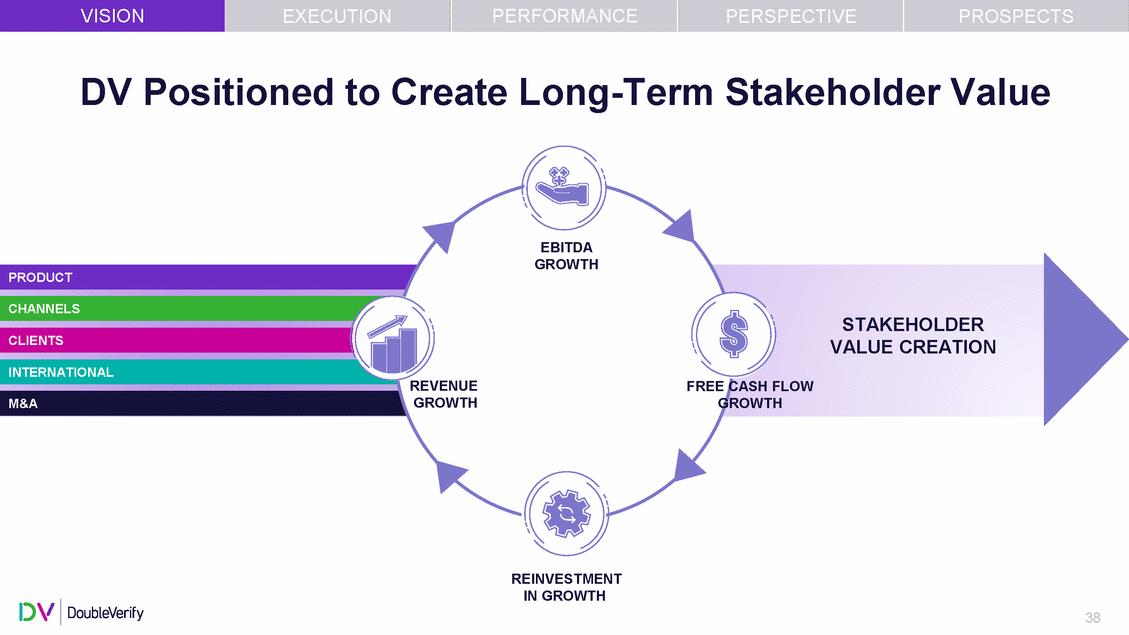
| VISION PERFORMANCE PROSPECTS EXECUTION PERSPECTIVE DV Positioned to Create Long-Term Stakeholder Value EBITDA GROWTH PRODUCT CHANNELS STAKEHOLDER VALUE CREATION CLIENTS INTERNATIONAL REVENUE FREE CASH FLOW GROWTH GROWTH M&A REINVESTMENT IN GROWTH 38 |
| DV solves measurement challenges and maximizes advertising outcomes resulting in exceptional growth that drives stakeholder value 39 |
| EXECUTION Jack Smith, Chief Product Officer 40 |
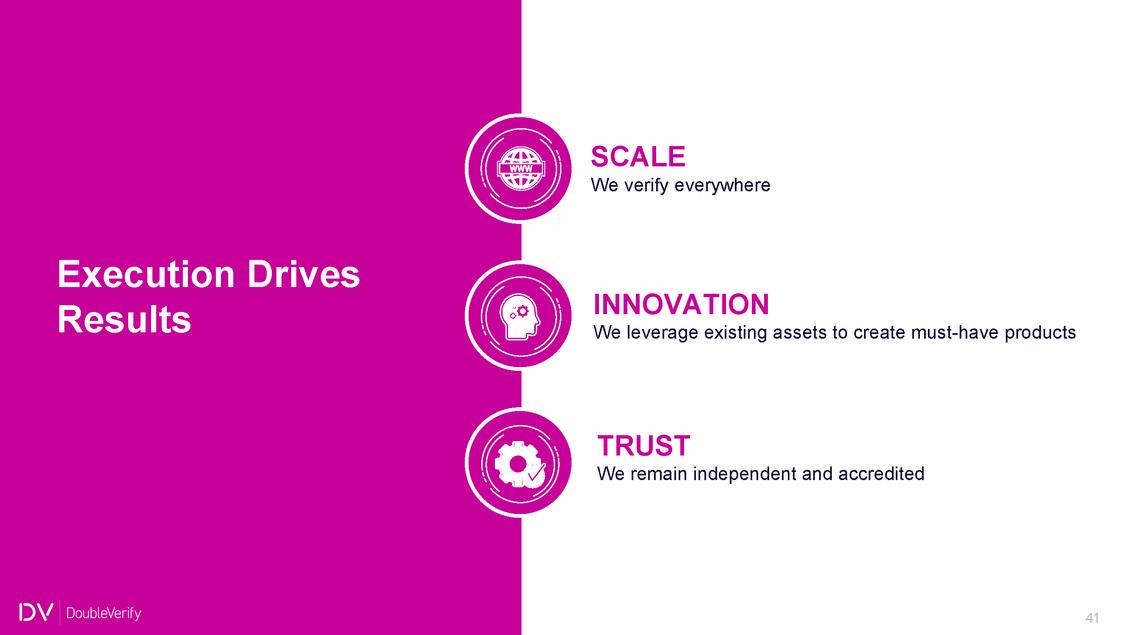
| SCALE We verify everywhere Execution Results Drives INNOVATION We leverage existing assets to create must-have products TRUST We remain independent and accredited 41 |
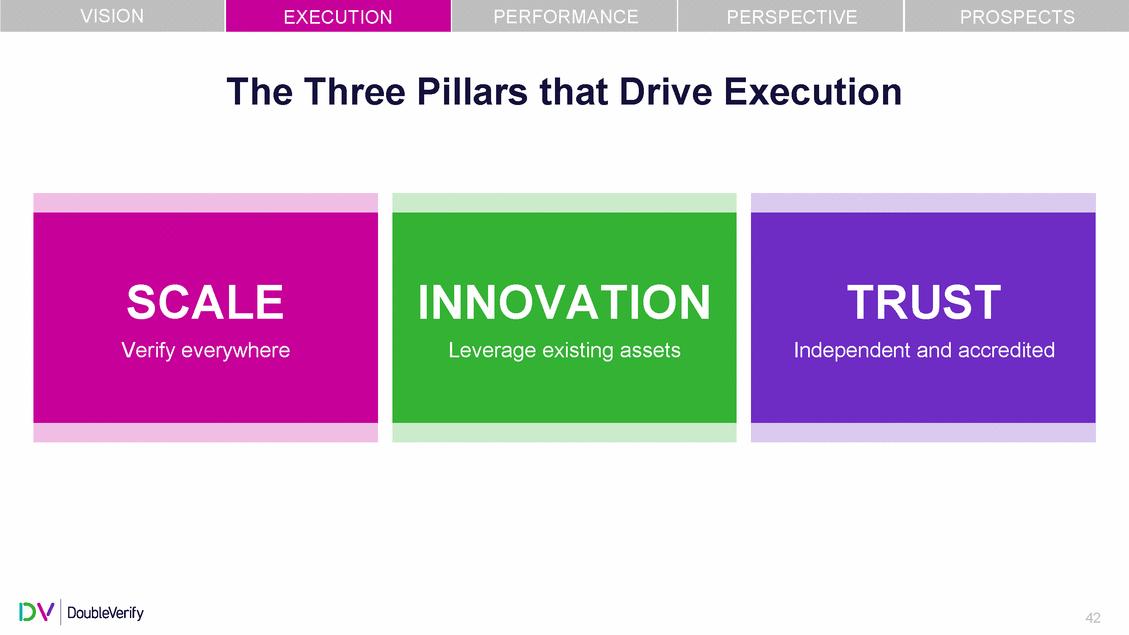
| VISION EXECUTION PERFORMANCE PERSPECTIVE PROSPECTS The Three Pillars that Drive Execution 42 INNOVATION Leverage existing assets SCALE Verify everywhere TRUST Independent and accredited |
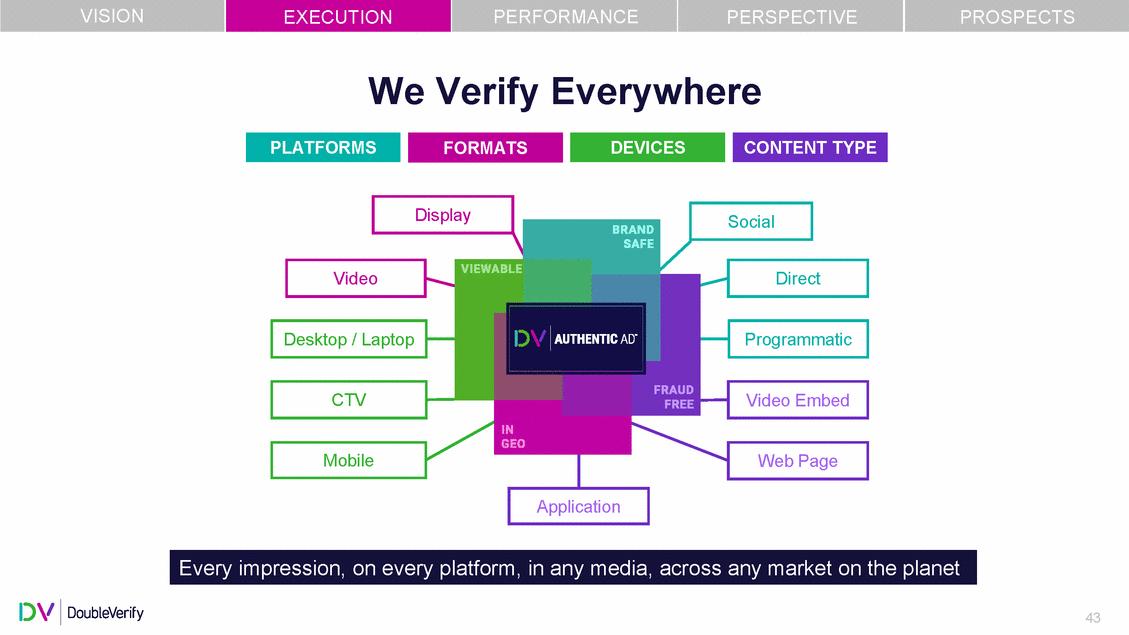
| VISION EXECUTION PERFORMANCE PERSPECTIVE PROSPECTS We Verify Everywhere 43 Every impression, on every platform, in any media, across any market on the planet Desktop / Laptop Programmatic CTV Video Embed Application Web Page Mobile Direct Video Social Display CONTENT TYPE PLATFORMS DEVICES FORMATS |
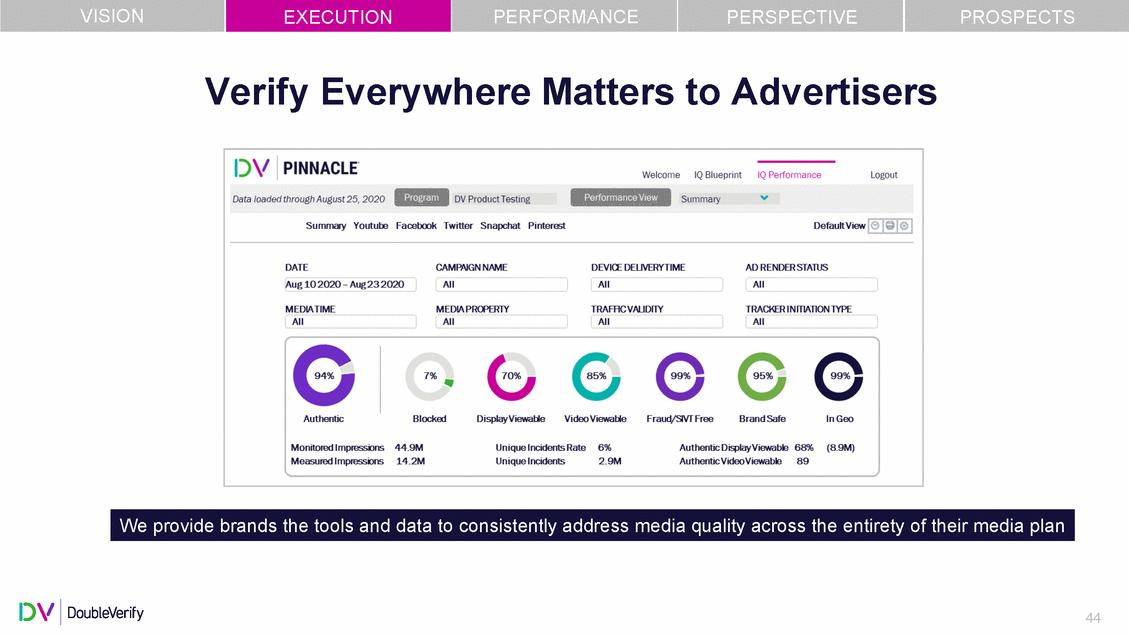
| VISION EXECUTION PERFORMANCE PERSPECTIVE PROSPECTS Verify Everywhere Matters to Advertisers 44 We provide brands the tools and data to consistently address media quality across the entirety of their media plan |
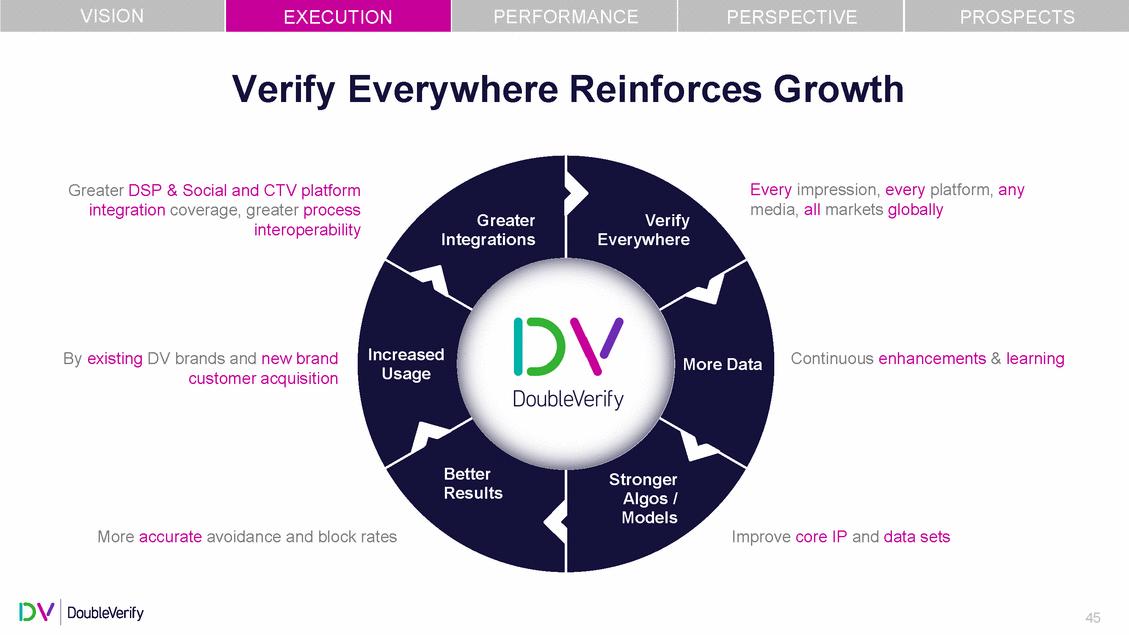
| VISION EXECUTION PERFORMANCE PERSPECTIVE PROSPECTS Verify Everywhere Reinforces Growth Greater DSP & Social and CTV platform integration coverage, greater process interoperability Every impression, every platform, any media, all markets globally Greater Integrations Verify Everywhere Increased Usage By existing DV brands and new brand customer acquisition Continuous enhancements & learning More Data Better Results Stronger Algos / Models More accurate avoidance and block rates Improve core IP and data sets 45 |
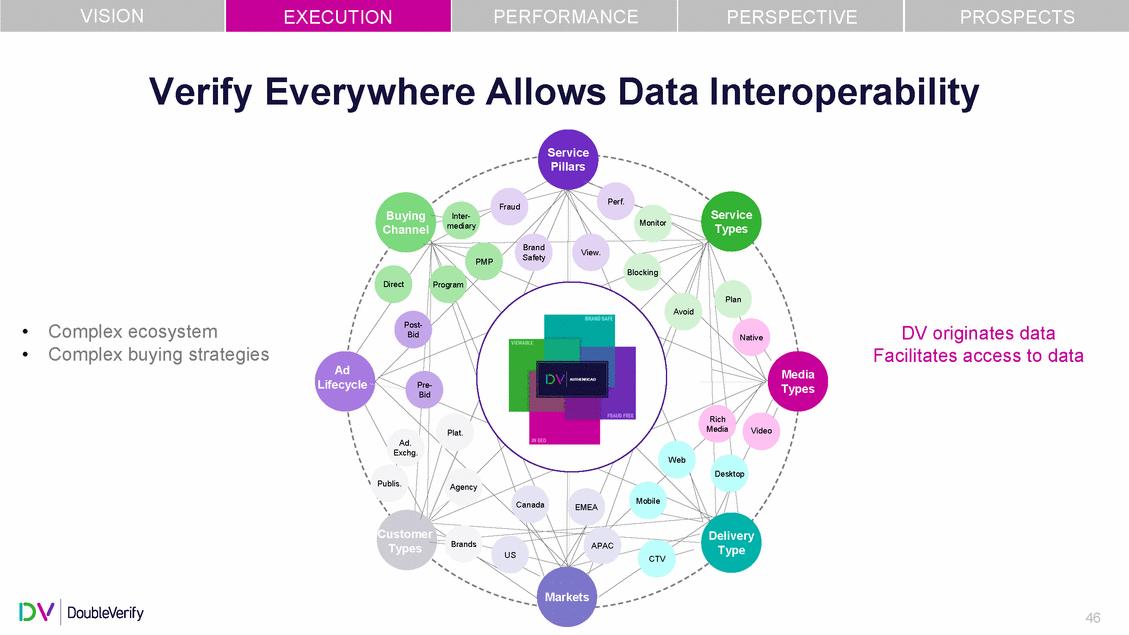
| VISION EXECUTION PERFORMANCE PERSPECTIVE PROSPECTS Verify Everywhere Allows Service Pillars Data Interoperability Service Types Buying Channel Inter-mediary Direct Plan Post-Bid • • Complex ecosystem Complex buying strategies DV originates data Facilitates access to data Native Ad Lifecycle Media Types P Bid Rich Media Video Ad. Exchg. Desktop Publis. cy Customer Delivery Type Brands APAC Types US CTV Markets 46 Fraud Perf. Monitor Brand PMPSafety re Program - Plat. Agen View. Blocking Avoid Web CanadaEMEAMobile |
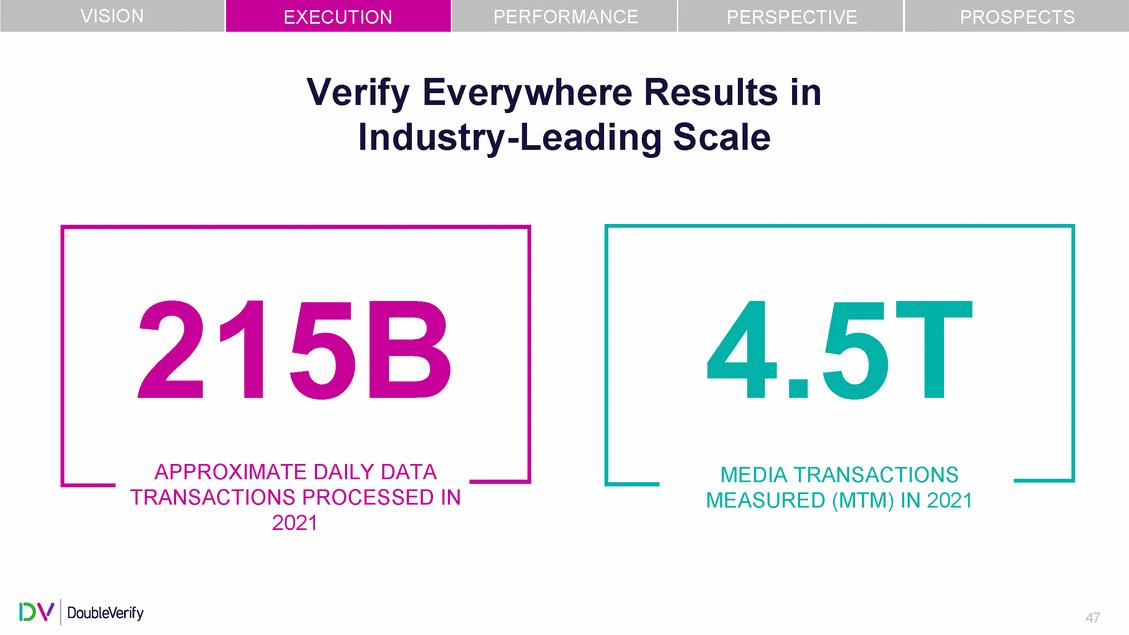
| VISION EXECUTION PERFORMANCE PERSPECTIVE PROSPECTS Verify Everywhere Results in Industry-Leading Scale TRANSACTIONS PROCESSED IN 2021 MEASURED (MTM) IN 2021 47 4.5T MEDIA TRANSACTIONS 215B APPROXIMATE DAILY DATA |
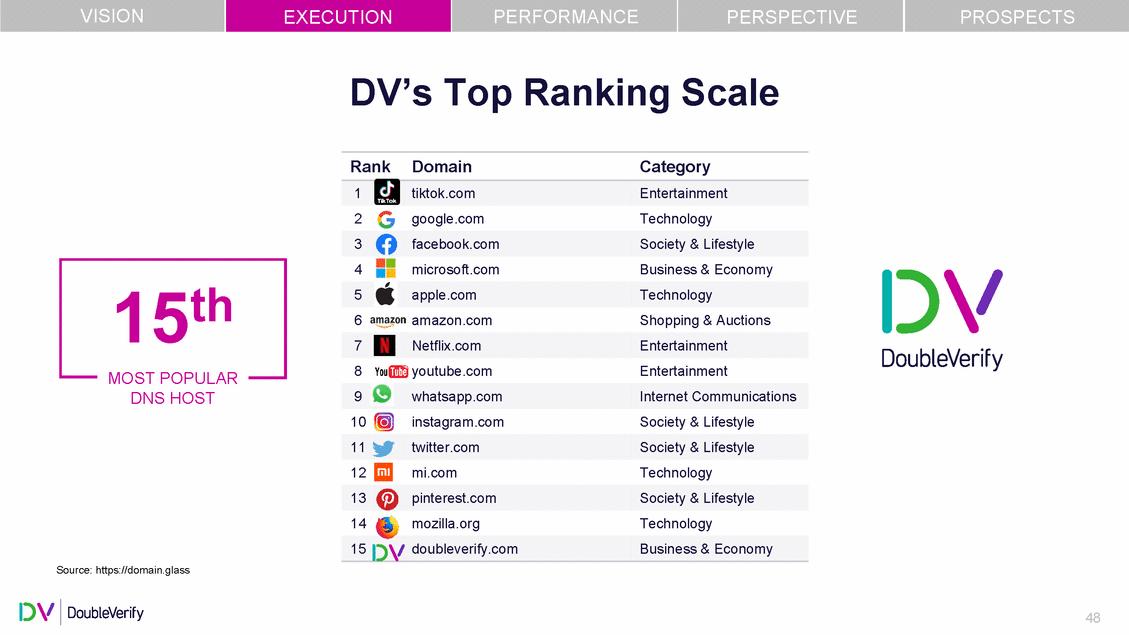
| VISION EXECUTION PERFORMANCE PERSPECTIVE PROSPECTS DV’s Top Ranking Scale Rank Domain Category 2 google.com Technology 4 microsoft.com Business & Economy 6 amazon.com Shopping & Auctions 8 youtube.com Entertainment MOST POPULAR DNS HOST 10 instagram.com Society & Lifestyle 12 mi.com Technology 14 mozilla.org Technology Source: https://domain.glass 48 15doubleverify.comBusiness & Economy 13pinterest.comSociety & Lifestyle 11twitter.comSociety & Lifestyle 9whatsapp.comInternet Communications 7Netflix.comEntertainment 5apple.comTechnology 15th 3facebook.comSociety & Lifestyle 1tiktok.comEntertainment |
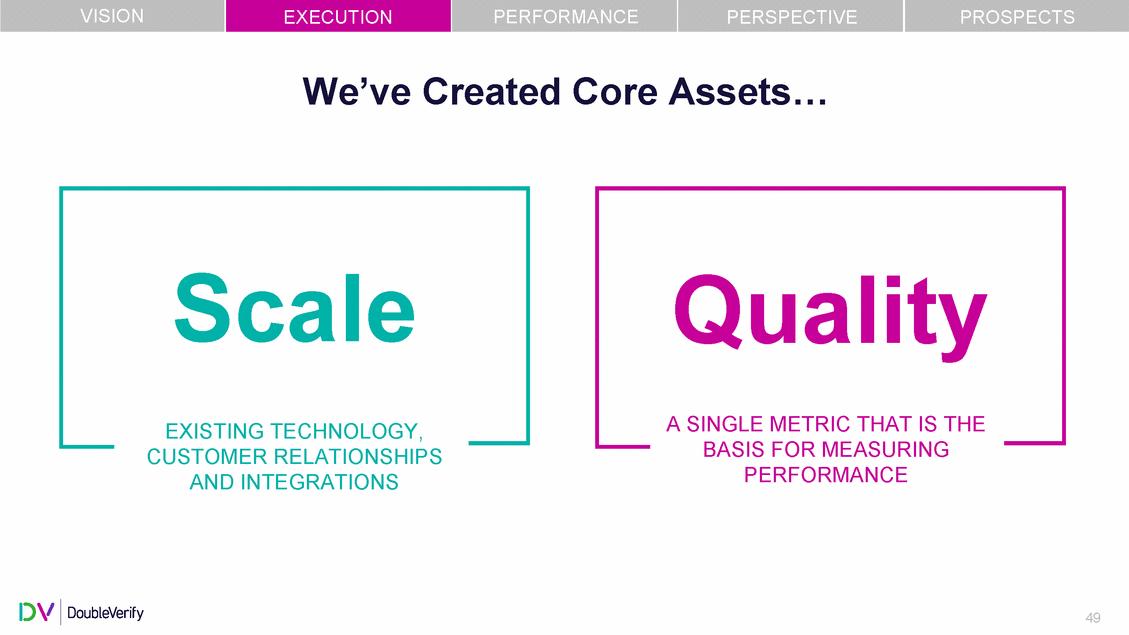
| VISION EXECUTION PERFORMANCE PERSPECTIVE PROSPECTS We’ve Created Core Assets… BASIS FOR MEASURING PERFORMANCE CUSTOMER RELATIONSHIPS AND INTEGRATIONS 49 Scale EXISTING TECHNOLOGY, Quality A SINGLE METRIC THAT IS THE |
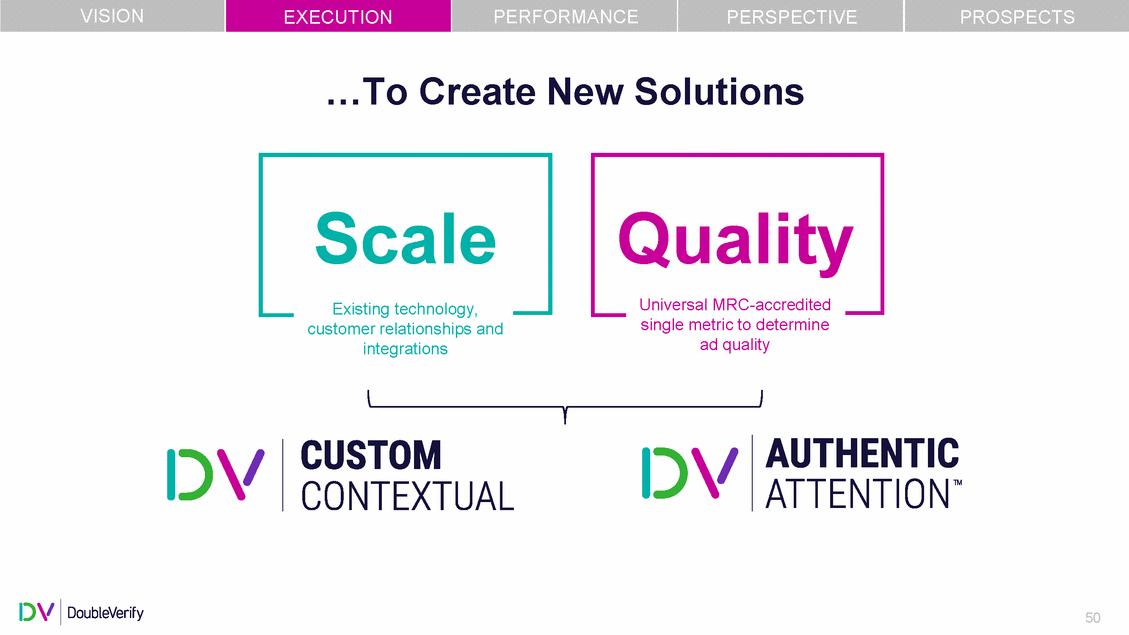
| VISION EXECUTION PERFORMANCE PERSPECTIVE PROSPECTS …To Create New Solutions Quality single metric to determine ad quality customer relationships and integrations 50 Scale Existing technology, Universal MRC-accredited |
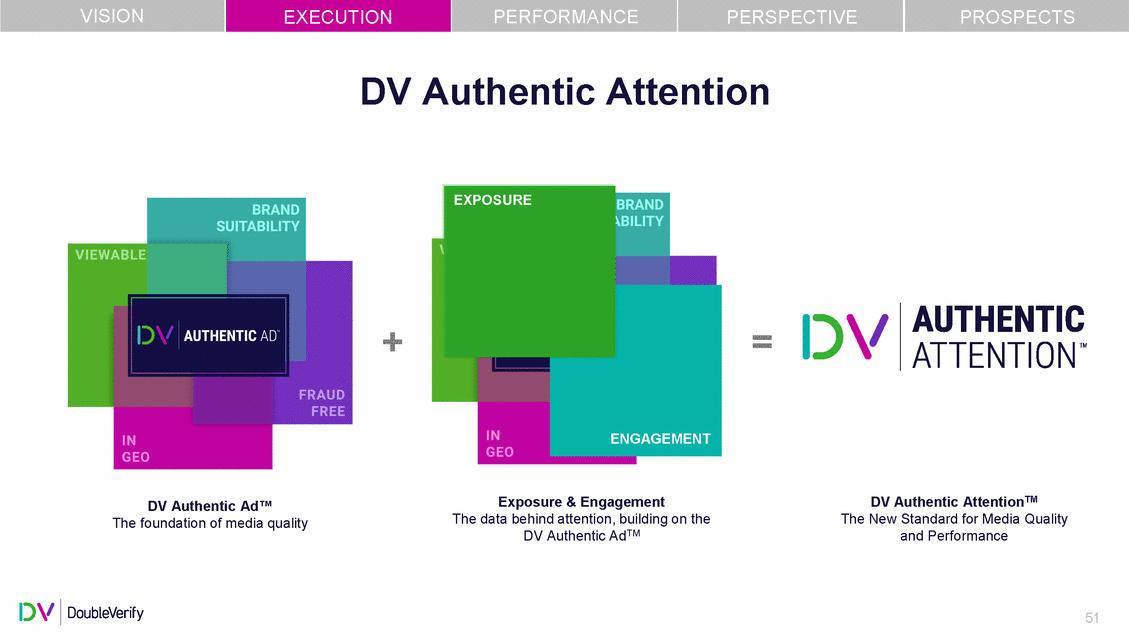
| VISION EXECUTION PERFORMANCE PERSPECTIVE PROSPECTS DV Authentic Attention + = ENGAGEMENT Exposure & Engagement The data behind attention, building on the DV Authentic AdTM DV Authentic AttentionTM The New Standard for Media Quality and Performance DV Authentic Ad™ The foundation of media quality 51 EXPOSURE |
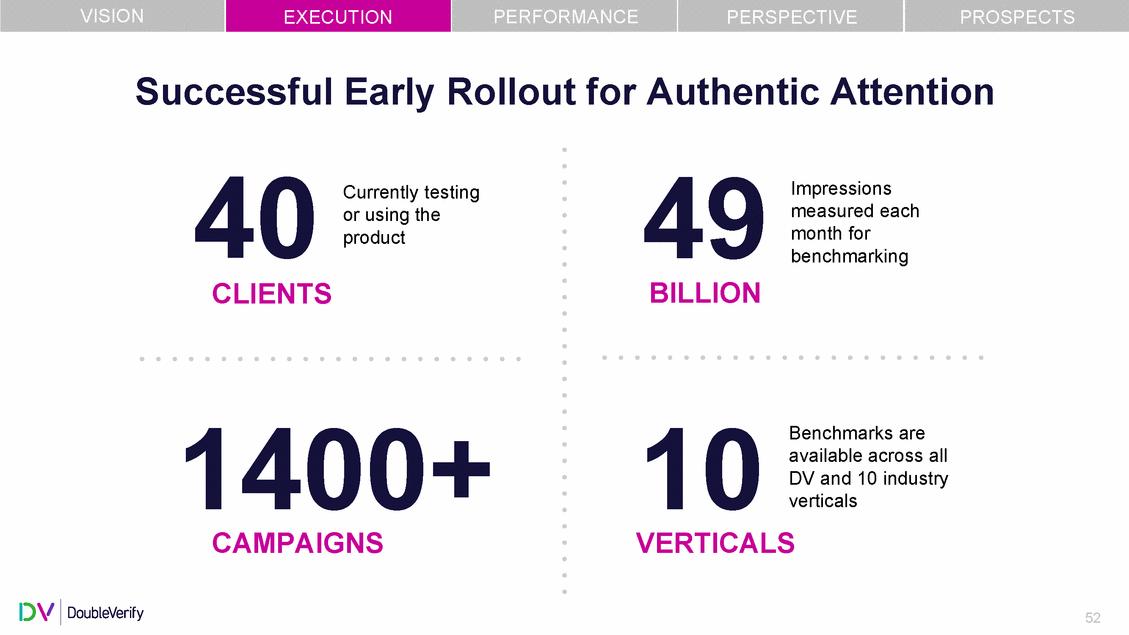
| VISION EXECUTION PERFORMANCE PERSPECTIVE PROSPECTS Successful Early Rollout for Authentic Attention 40 CLIENTS 49 BILLION Impressions measured each month for benchmarking Currently testing or using the product 1400+ CAMPAIGNS 10 Benchmarks are available across all DV and 10 industry verticals VERTICALS 52 |
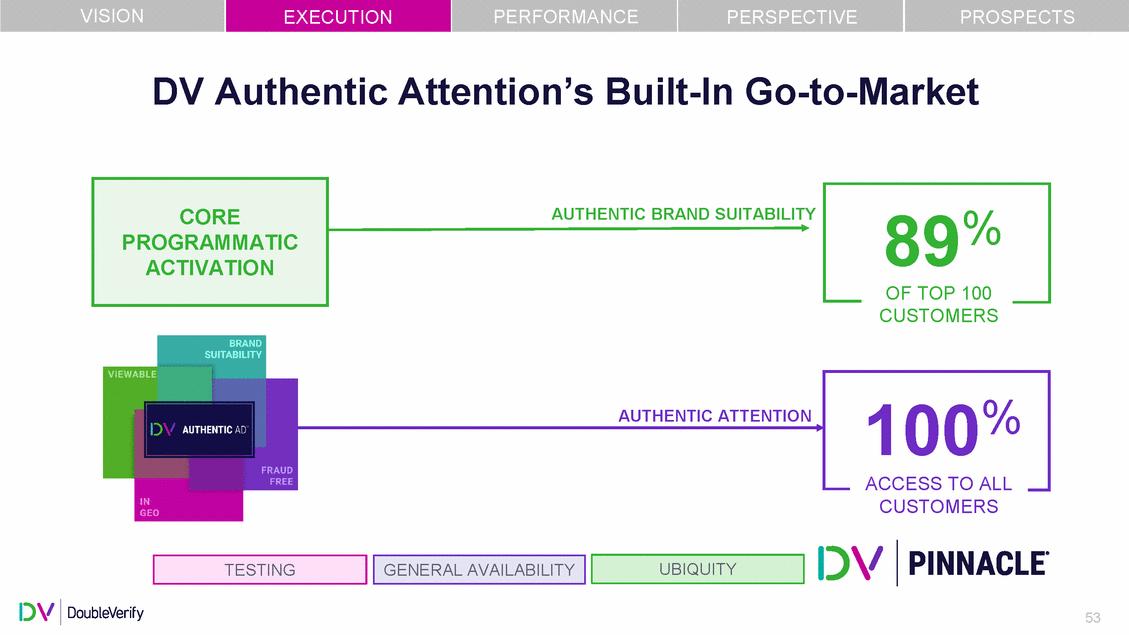
| VISION EXECUTION PERFORMANCE PERSPECTIVE PROSPECTS DV Authentic Attention’s Built-In Go-to-Market AUTHENTIC BRAND SUITABILITY CUSTOMERS AUTHENTIC ATTENTION CUSTOMERS 53 UBIQUITY TESTING GENERAL AVAILABILITY 100% ACCESS TO ALL 89% OF TOP 100 CORE PROGRAMMATIC ACTIVATION |
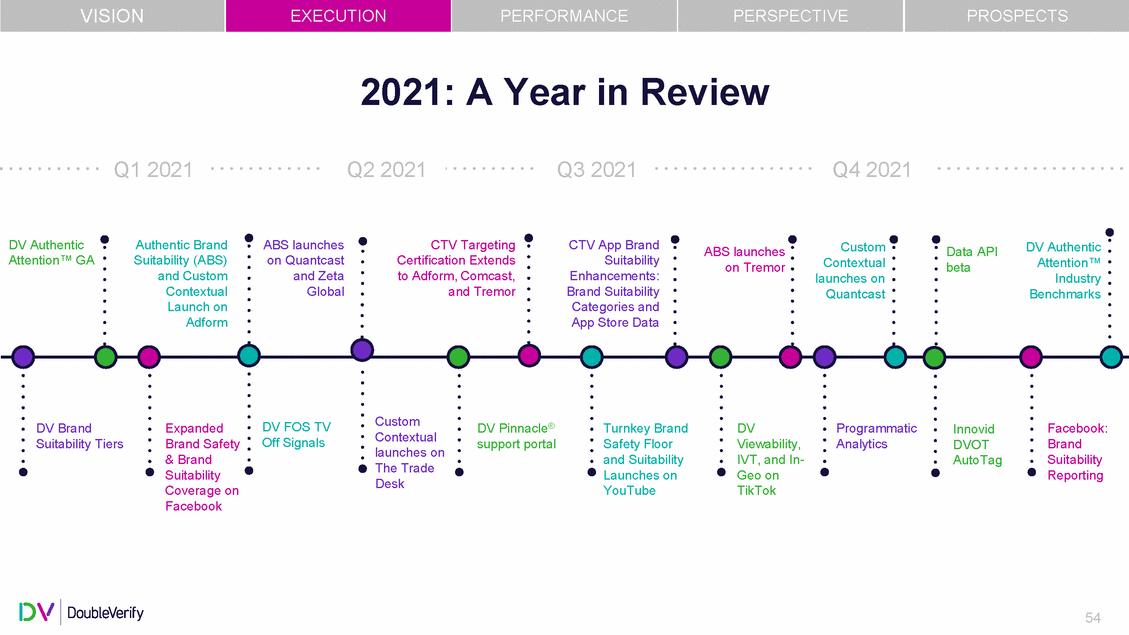
| VISION EXECUTION PERFORMANCE PERSPECTIVE PROSPECTS 2021: A Year in Review Q1 2021 Q2 2021 Q3 2021 Q4 2021 DV Authentic Attention™ GA Authentic Brand Suitability (ABS) and Custom Contextual Launch on Adform ABS launches on Quantcast and Zeta Global CTV Targeting Certification Extends to Adform, Comcast, and Tremor CTV App Brand Suitability Enhancements: Brand Suitability Categories and App Store Data Custom Contextual launches on Quantcast DV Authentic Attention™ Industry Benchmarks ABS launches on Tremor Data API beta Custom Contextual launches on The Trade Desk DV FOS TV Off Signals DV Brand Suitability Tiers Expanded Brand Safety & Brand Suitability Coverage on Facebook DV Pinnacle® support portal Turnkey Brand Safety Floor and Suitability Launches on YouTube DV Viewability, IVT, and In-Geo on TikTok Programmatic Analytics Facebook: Brand Suitability Reporting Innovid DVOT AutoTag 54 |
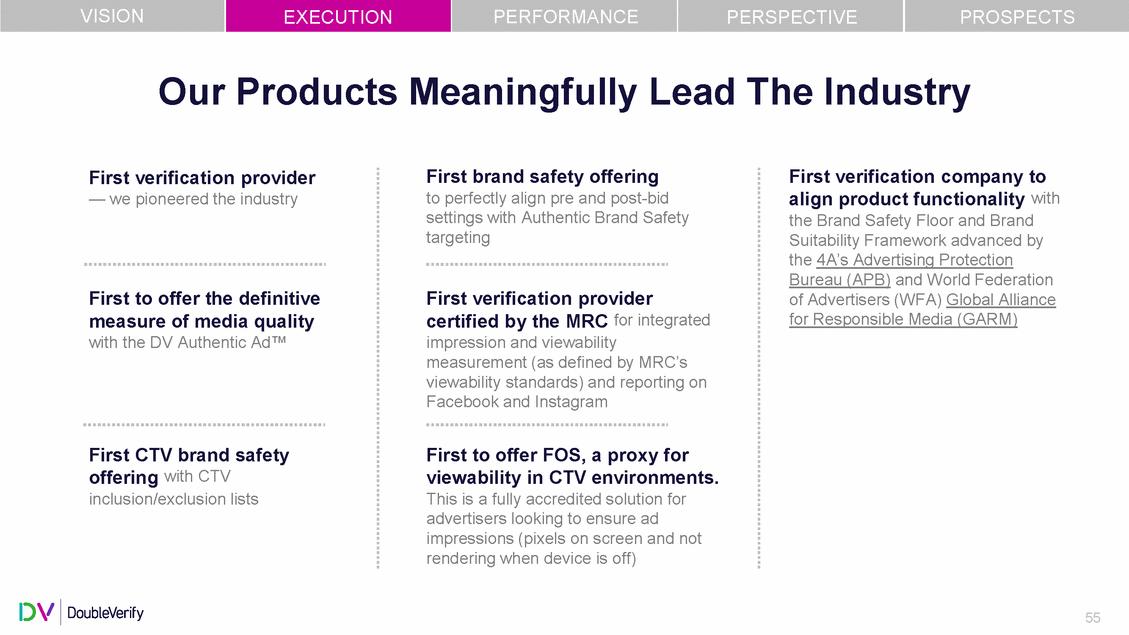
| VISION EXECUTION PERFORMANCE PERSPECTIVE PROSPECTS Our Products Meaningfully Lead The Industry First brand safety offering to perfectly align pre and post-bid settings with Authentic Brand Safety targeting First verification company to First verification provider — we pioneered the industry align product functionality with the Brand Safety Floor and Brand Suitability Framework advanced by the 4A’s Advert is ing Prot ec t ion Bureau (APB) and World Federation First to offer the definitive measure of media quality with the DV Authentic Ad™ First verification provider certified by the MRC for integrated impression and viewability measurement (as defined by MRC’s viewability standards) and reporting on Facebook and Instagram of Advertisers (WFA) Global Alliance for Responsible Media (GARM) First CTV brand safety offering with CTV inclusion/exclusion lists First to offer FOS, a proxy for viewability in CTV environments. This is a fully accredited solution for advertisers looking to ensure ad impressions (pixels on screen and not rendering when device is off) 55 |
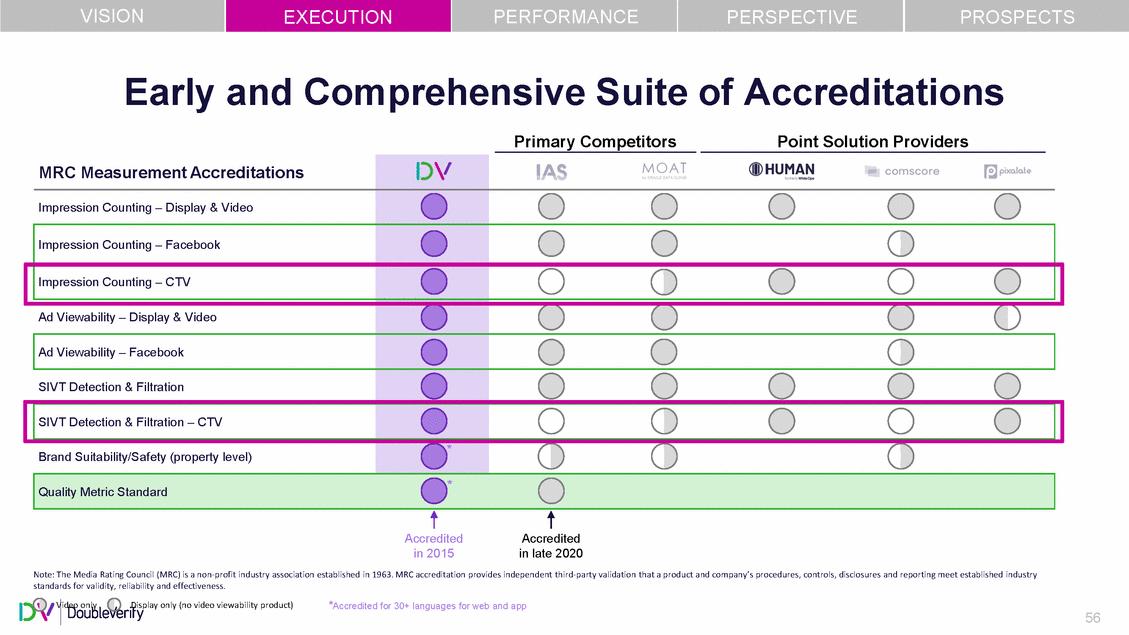
| VISION EXECUTION PERFORMANCE PERSPECTIVE PROSPECTS Early and Comprehensive Suite Primary Competitors of Accreditations Point Solution Providers Accredited in 2015 Accredited in late 2020 Note: The Media Rating Council (MRC) is a non-profit industry association established in 1963. MRC accreditation provides independent third-party validation that a product and company’s procedures, controls, disclosures and reporting meet established industry standards for validity, reliability and effectiveness. *Accredited for 30+ languages for web and app Video only Display only (no video viewability product) 56 MRC Measurement Accreditations Impression Counting – Display & Video Impression Counting – Facebook Impression Counting – CTV Ad Viewability – Display & Video Ad Viewability – Facebook SIVT Detection & Filtration SIVT Detection & Filtration – CTV Brand Suitability/Safety (property level) * Quality Metric Standard* |
| VISION EXECUTION PERFORMANCE PERSPECTIVE PROSPECTS DV Product Strategy 57 INNOVATION Leverage existing assets SCALE Verify everywhere TRUST Independent and accredited |
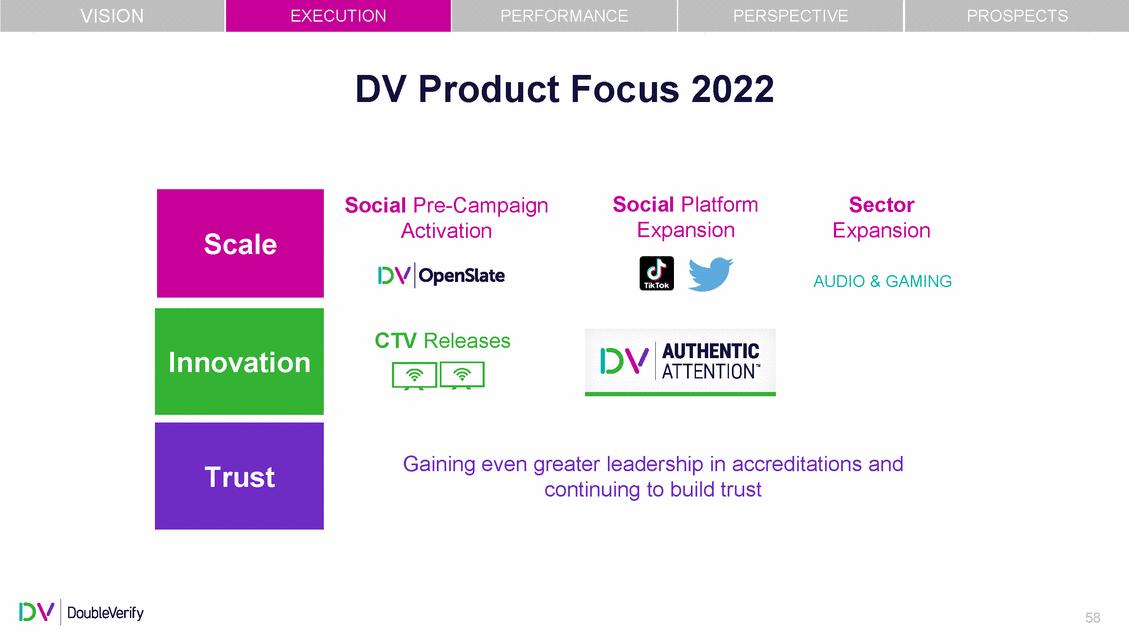
| VISION EXECUTION PERFORMANCE PERSPECTIVE PROSPECTS DV Product Focus 2022 Social Pre-Campaign Activation Social Platform Expansion Sector Expansion AUDIO & GAMING CTV Releases Gaining even greater leadership in accreditations and continuing to build trust 58 Trust Innovation Scale |
| PRODUCT DEMOS Dan Slivjanovski, Chief Marketing Officer 59 |
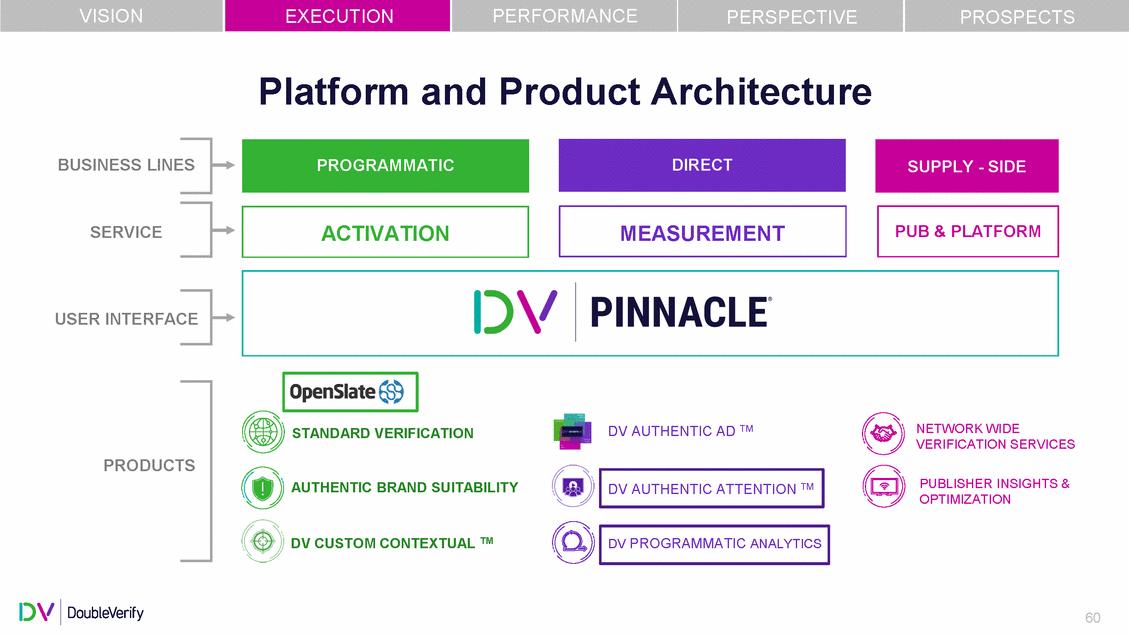
| VISION PERFORMANCE EXECUTION PERSPECTIVE PROSPECTS Platform and Product Architecture BUSINESS LINES SERVICE USER INTERFACE NETWORK WIDE VERIFICATION SERVICES DV AUTHENTIC AD TM STANDARD VERIFICATION PRODUCTS PUBLISHER INSIGHTS & OPTIMIZATION AUTHENTIC BRAND SUITABILITY DV CUSTOM CONTEXTUAL TM 60 DV PROGRAMMATIC ANALYTICS DV AUTHENTIC ATTENTION TM PUB & PLATFORM MEASUREMENT ACTIVATION SUPPLY - SIDE DIRECT PROGRAMMATIC |
| AUTHENTIC |
| OpenSlate I |
| 63 IntrotoProgrammatic Analytics |
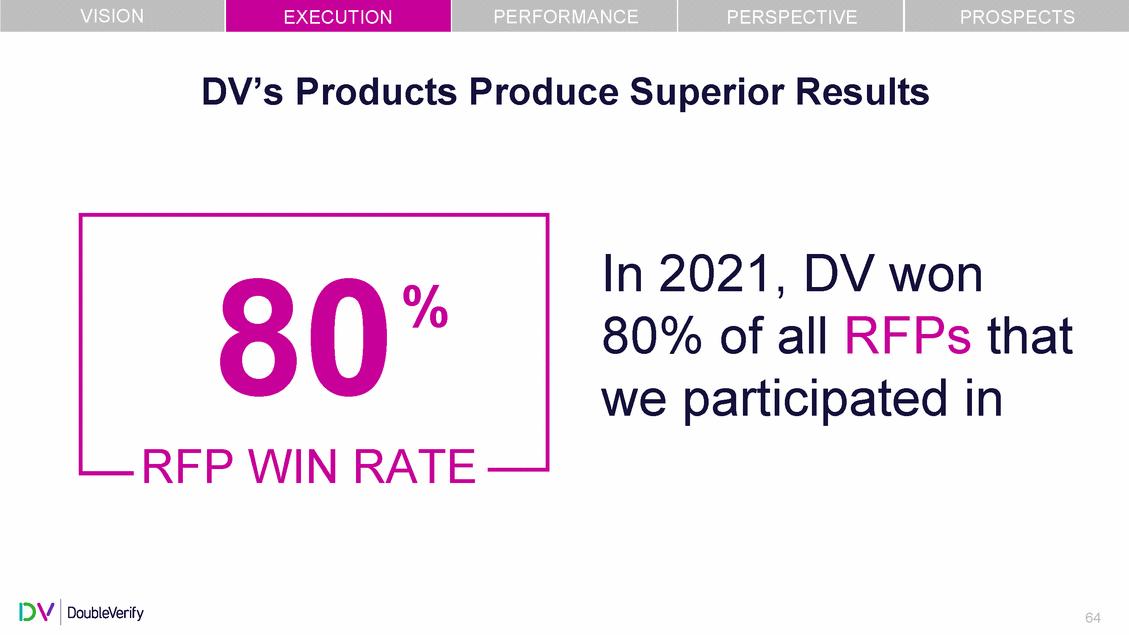
| VISION EXECUTION PERFORMANCE PERSPECTIVE PROSPECTS DV’s Products Produce Superior Results In 2021, DV won 80% of all RFPs that we participated in RFPWINRATE 64 80% |
| PERFORMANCE Nicolas Allais, CFO 65 |
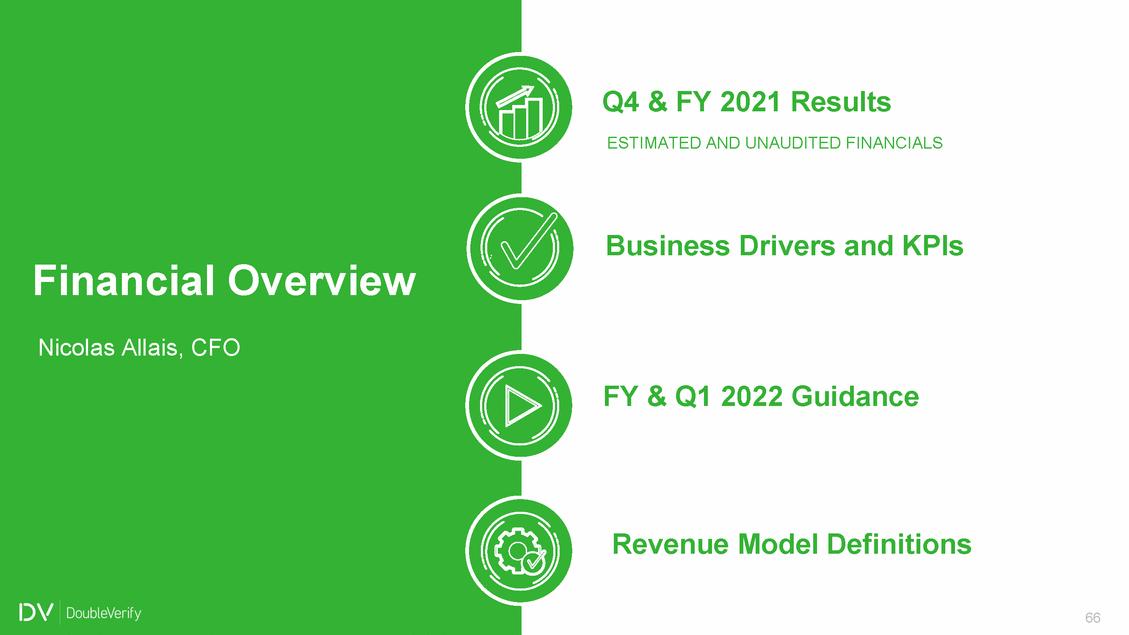
| Q4 & FY 2021 Results ESTIMATED AND UNAUDITED FINANCIALS Business Drivers and KPIs FinancialOverview Nicolas Allais, CFO FY & Q1 2022 Guidance Revenue Model Definitions 66 |
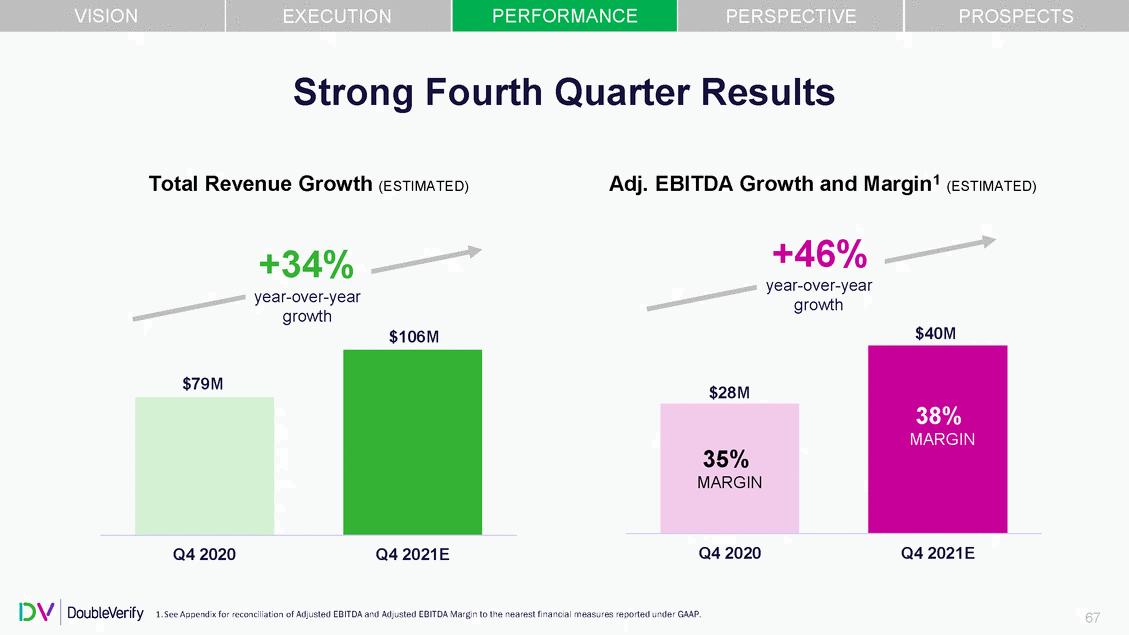
| VISION PERFORMANCE PROSPECTS EXECUTION PERSPECTIVE Strong Fourth Quarter Results Margin1 (ESTIMATED) Total Revenue Growth (ESTIMATED) Adj. EBITDA Growth and +46% year-over-year +34% year-over-year growth growth $40M $106M Q4 2020 Q4 2021E Q4 2020 Q4 2021E 1. See Appendix for reconciliation of Adjusted EBITDA and Adjusted EBITDA Margin to the nearest financial measures reported under GAAP. 67 $79M $28M 38% MARGIN 35% MARGIN |
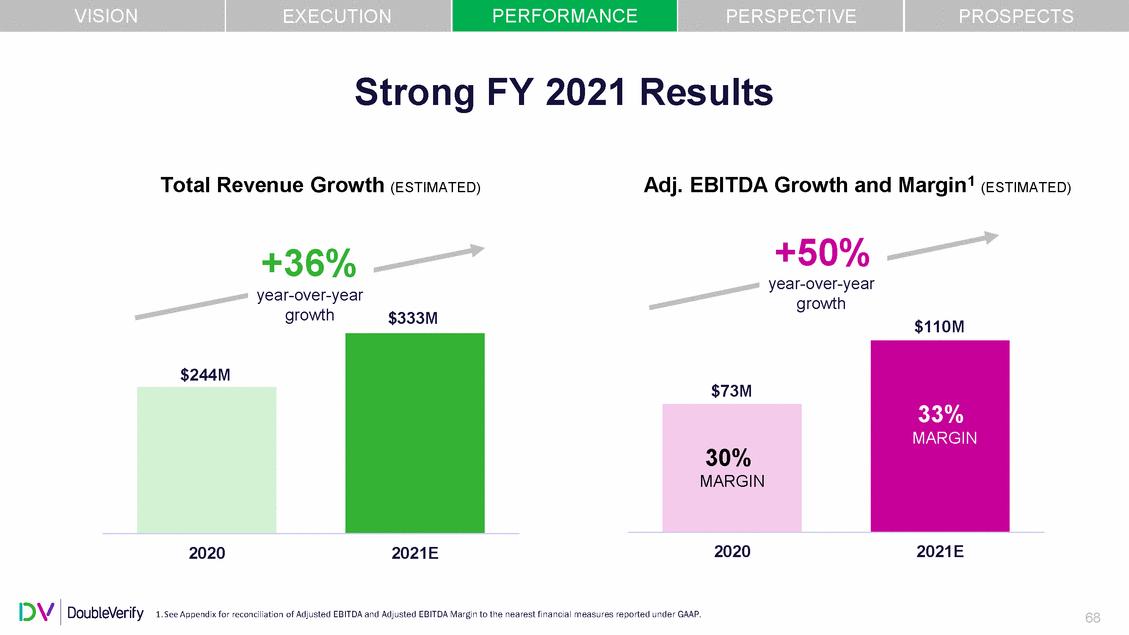
| VISION PERFORMANCE PROSPECTS EXECUTION PERSPECTIVE Strong FY 2021 Results Margin1 (ESTIMATED) Total Revenue Growth (ESTIMATED) Adj. EBITDA Growth and +50% year-over-year +36% year-over-year growth growth $333M $110M 2020 2021E 2020 2021E 1. See Appendix for reconciliation of Adjusted EBITDA and Adjusted EBITDA Margin to the nearest financial measures reported under GAAP. 68 $73M 33% MARGIN 30% MARGIN $244M |
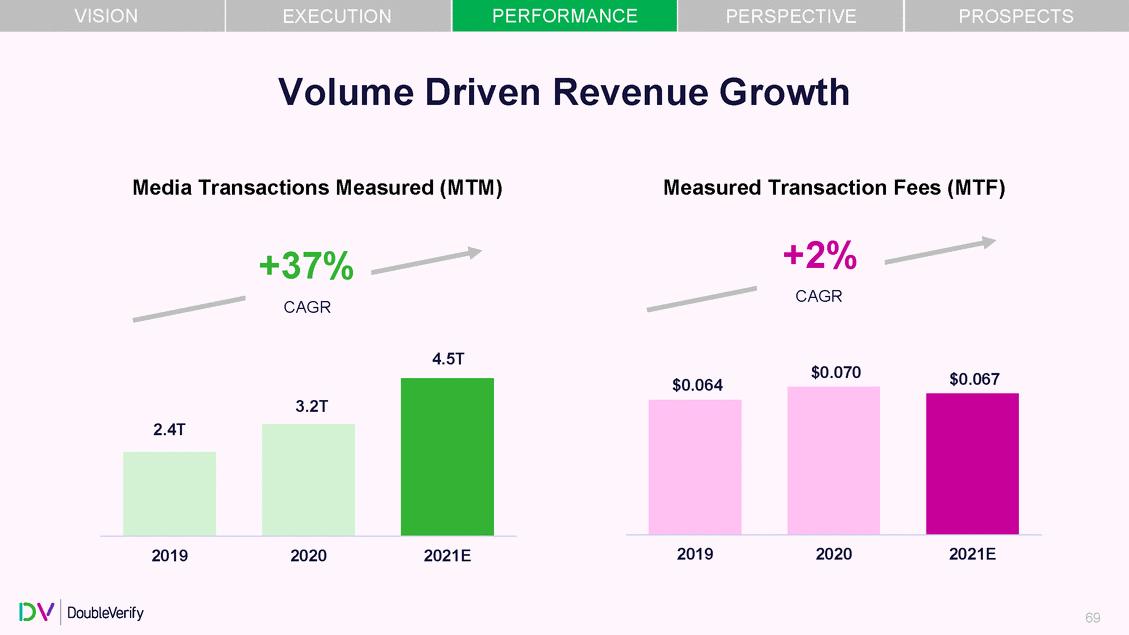
| VISION PERFORMANCE PROSPECTS EXECUTION PERSPECTIVE Volume Driven Revenue Growth Media Transactions Measured (MTM) Measured Transaction Fees (MTF) +2% +37% CAGR CAGR 4.5T $0.070 $0.067 $0.064 2019 2020 2021E 2019 2020 2021E 69 3.2T 2.4T |
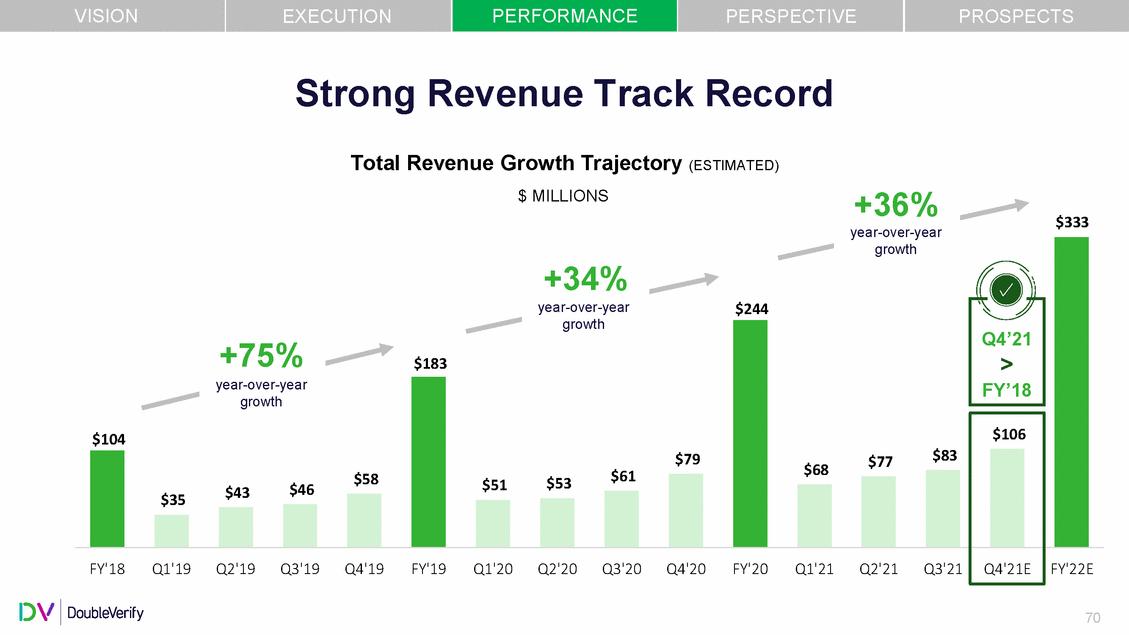
| VISION PERFORMANCE PROSPECTS EXECUTION PERSPECTIVE Strong Revenue Track Record Total Revenue Growth Trajectory $ MILLIONS (ESTIMATED) +36% year-over-year $333 growth $68 $46 $43 $35 70 growth +34% year-over-year$244 growth +75%$183 year-over-year $104 $79 $77$83 $106 $58 $53$61 $51 FY'18Q1'19Q2'19Q3'19Q4'19FY'19Q1'20Q2'20Q3'20Q4'20FY'20Q1'21Q2'21Q3'21 Q4'21E FY'22E Q4’21 > FY’18 |
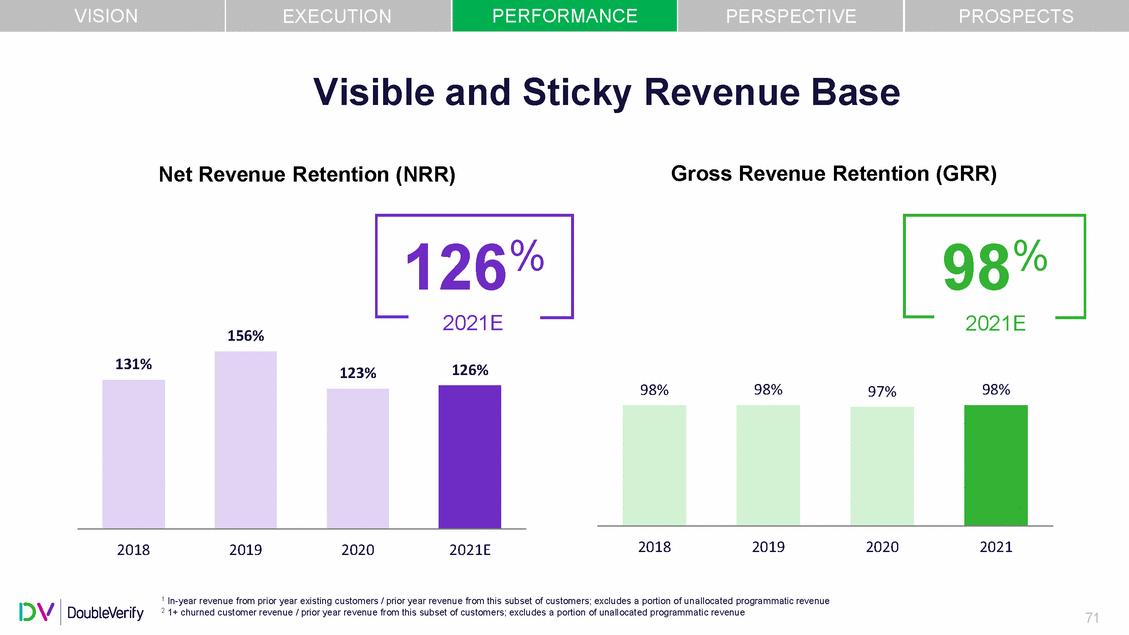
| VISION PERFORMANCE PROSPECTS EXECUTION PERSPECTIVE Visible and Sticky Revenue Base Gross Revenue Retention (GRR) Net Revenue Retention (NRR) 126% 2021E 2021E 156% 98% 98% 98% 97% 2018 2019 2020 2021 2018 2019 2020 2021E 1 In-year revenue from prior year existing customers / prior year revenue from this subset of customers; excludes a portion of unallocated programmatic revenue 2 1+ churned customer revenue / prior year revenue from this subset of customers; excludes a portion of unallocated programmatic revenue 71 131% 123%126% 98% |
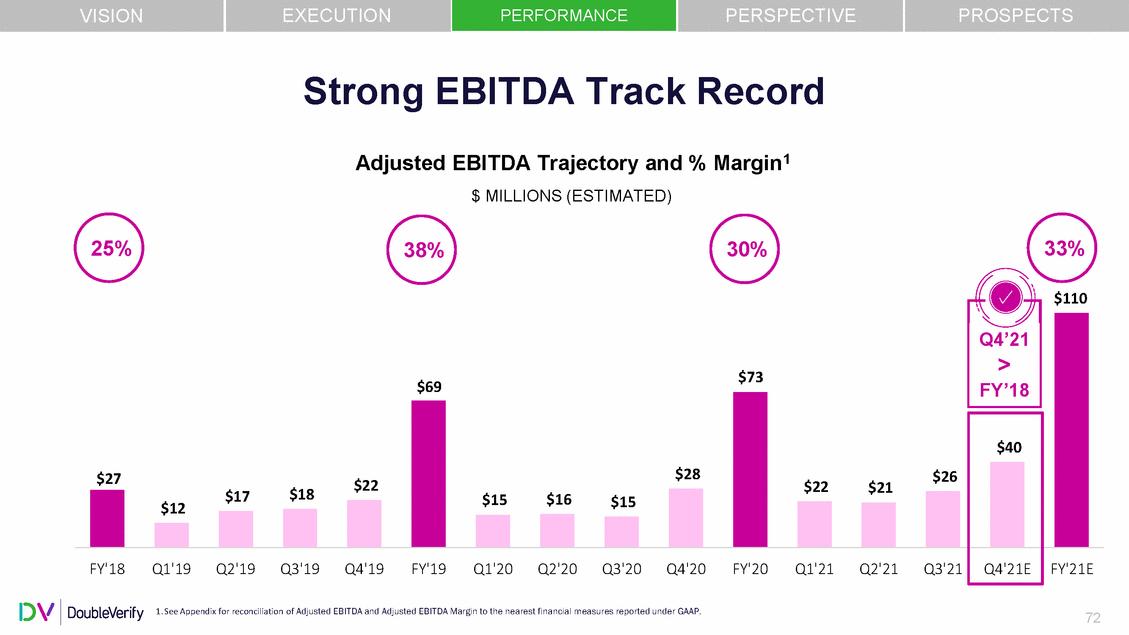
| VISION EXECUTION PERSPECTIVE PROSPECTS PERFORMANCE Strong EBITDA Track Record Adjusted EBITDA Trajectory and $ MILLIONS (ESTIMATED) % Margin1 25% 33% 38% 30% $110 $22 $18 $17 $15 $12 1. See Appendix for reconciliation of Adjusted EBITDA and Adjusted EBITDA Margin to the nearest financial measures reported under GAAP. 72 $69$73 $27 $28 $26 $22$21 $40 $15$16 FY'18Q1'19Q2'19Q3'19Q4'19FY'19Q1'20Q2'20Q3'20Q4'20FY'20Q1'21Q2'21Q3'21 Q4'21E FY'21E Q4’21 > FY’18 |
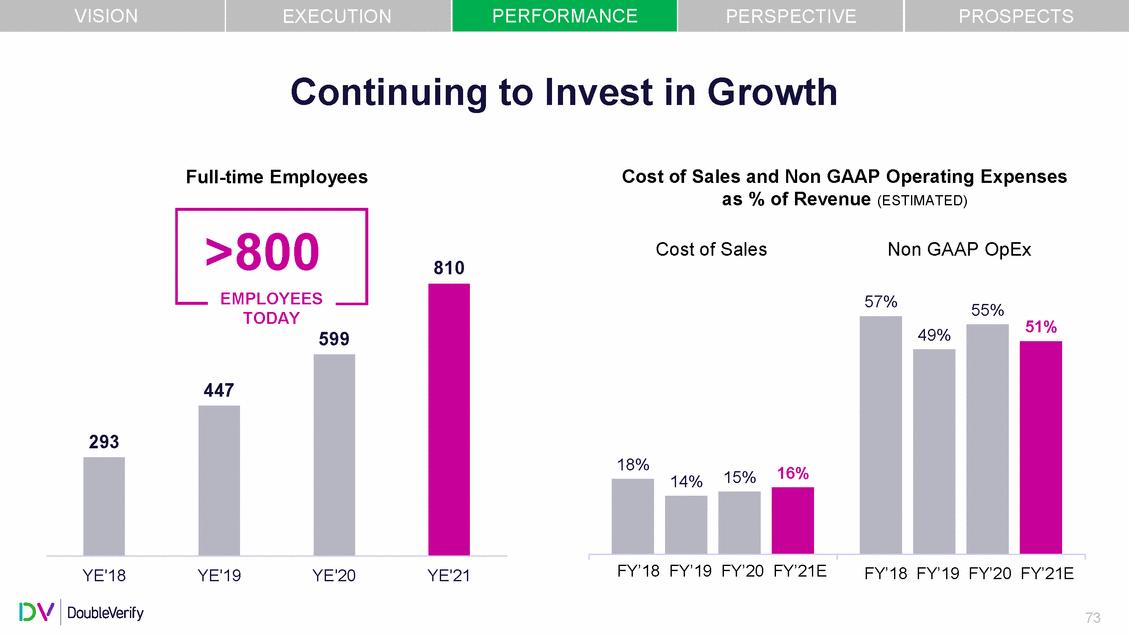
| VISION PERFORMANCE PROSPECTS EXECUTION PERSPECTIVE Continuing to Invest in Growth Cost of Sales and Non GAAP Operating Expenses as % of Revenue (ESTIMATED) Full-time Employees >800 Cost of Sales Non GAAP OpEx 810 57% 55% 51% 16% 15% 14% FY’18 FY’19 FY’20 FY’21E FY’18 FY’19 FY’20 FY’21E YE'18 YE'19 YE'20 YE'21 73 18% 49% TODAY 599 447 293 EMPLOYEES |
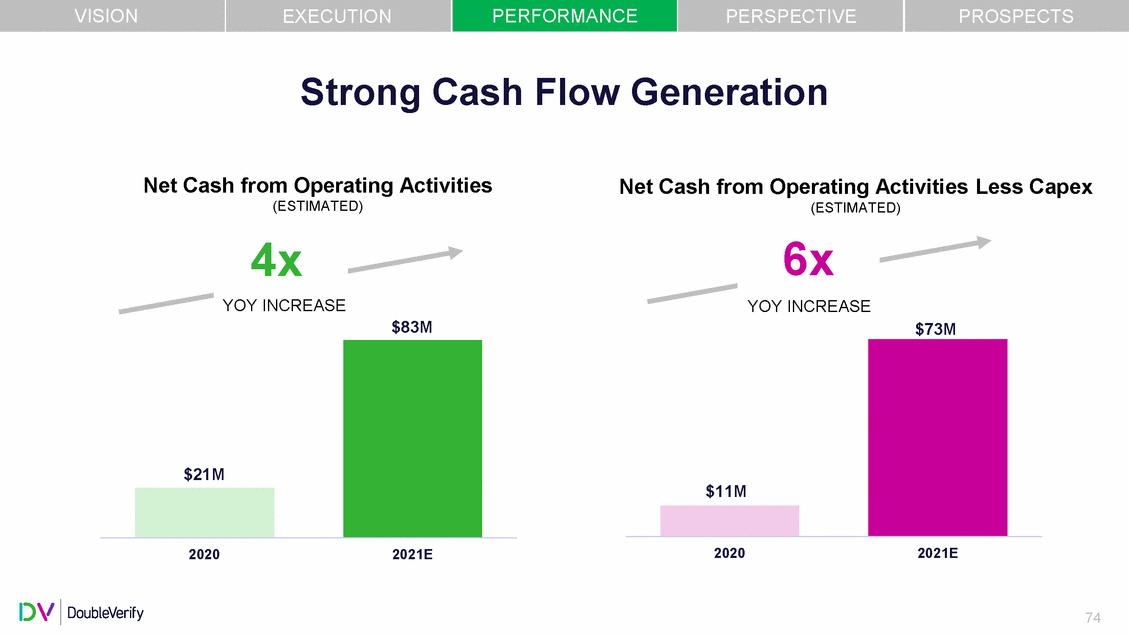
| VISION PERFORMANCE PROSPECTS EXECUTION PERSPECTIVE Strong Cash Flow Generation Net Cash from Operating Activities (ESTIMATED) Net Cash from Operating Activities (ESTIMATED) Less Capex 4x 6x YOY INCREASE YOY INCREASE $83M $73M 2020 2021E 2020 2021E 74 $11M $21M |
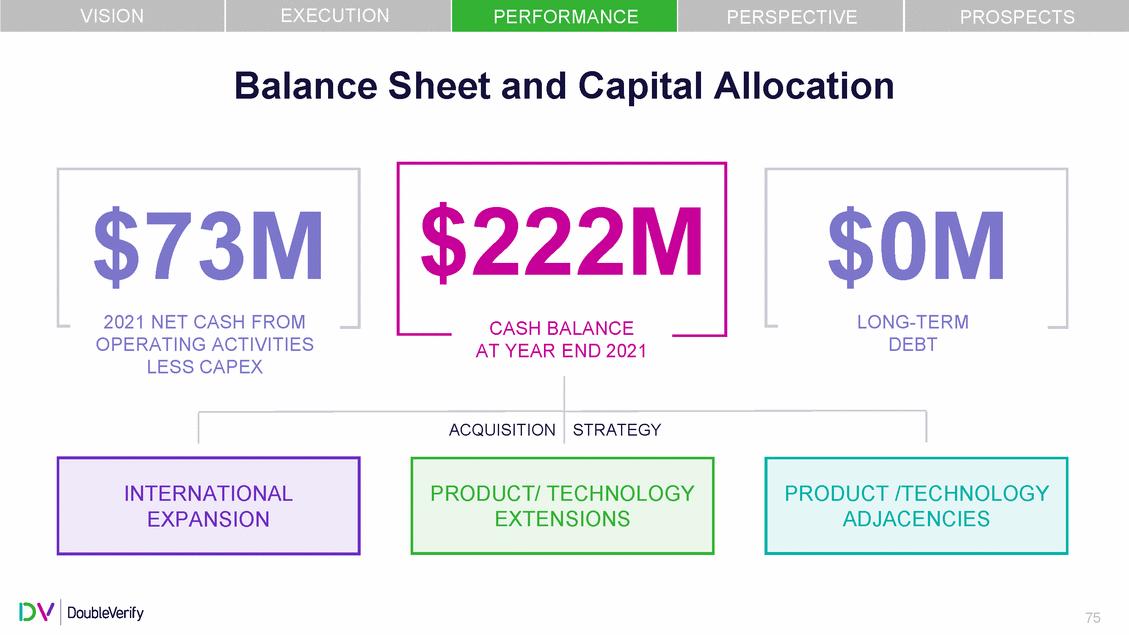
| VISION EXECUTION PERFORMANCE PERSPECTIVE PROSPECTS Balance Sheet and Capital Allocation $222M $73M 2021 NET CASH FROM OPERATING ACTIVITIES LESS CAPEX DEBT AT YEAR END 2021 75 PRODUCT /TECHNOLOGY ADJACENCIES PRODUCT/ TECHNOLOGY EXTENSIONS INTERNATIONAL EXPANSION ACQUISITION STRATEGY $0M LONG-TERM CASH BALANCE |
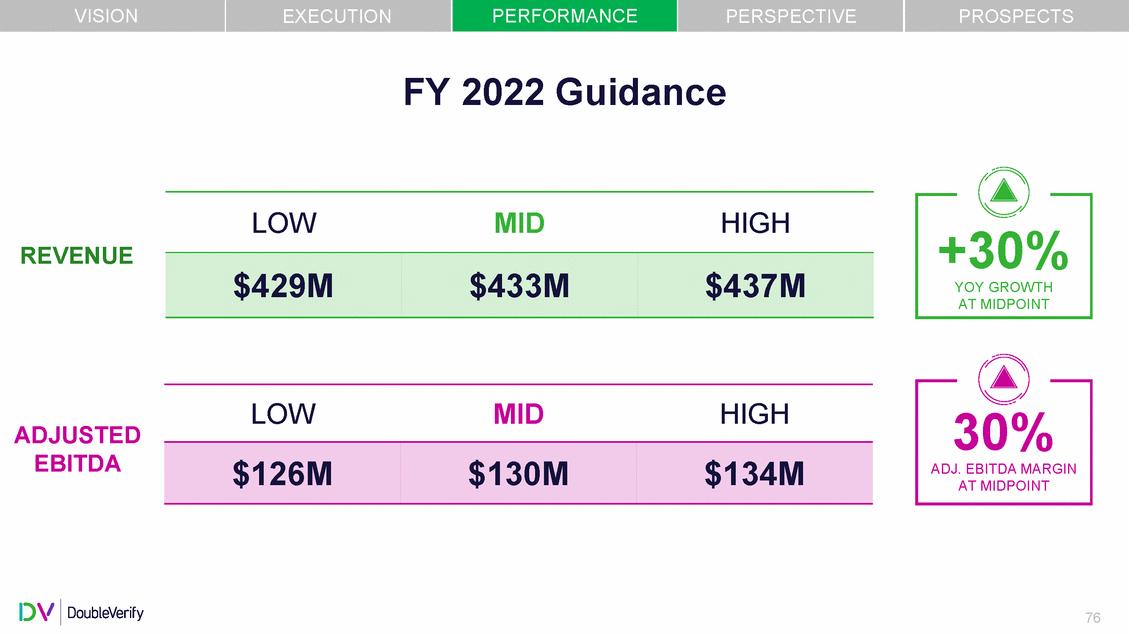
| VISION PERFORMANCE PROSPECTS EXECUTION PERSPECTIVE FY 2022 Guidance LOW MID HIGH REVENUE LOW MID HIGH ADJUSTED EBITDA 76 $126M$130M$134M 30% ADJ. EBITDA MARGIN AT MIDPOINT $429M$433M$437M +30% YOY GROWTH AT MIDPOINT |
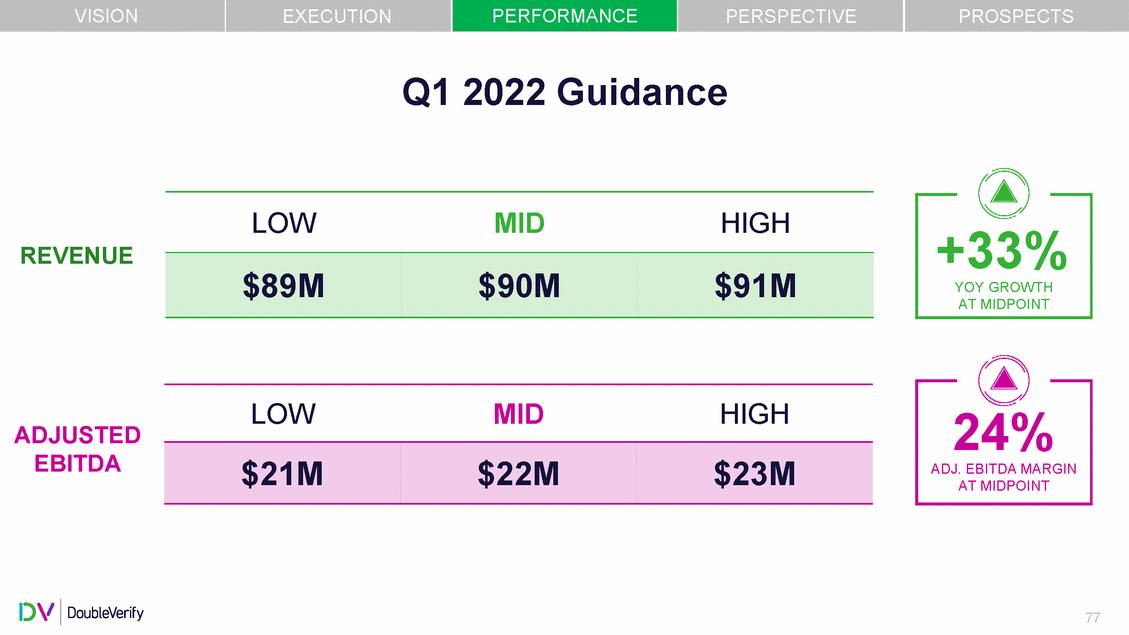
| VISION PERFORMANCE PROSPECTS EXECUTION PERSPECTIVE Q1 2022 Guidance LOW MID HIGH REVENUE LOW MID HIGH ADJUSTED EBITDA 77 $21M$22M$23M 24% ADJ. EBITDA MARGIN AT MIDPOINT $89M$90M$91M +33% YOY GROWTH AT MIDPOINT |
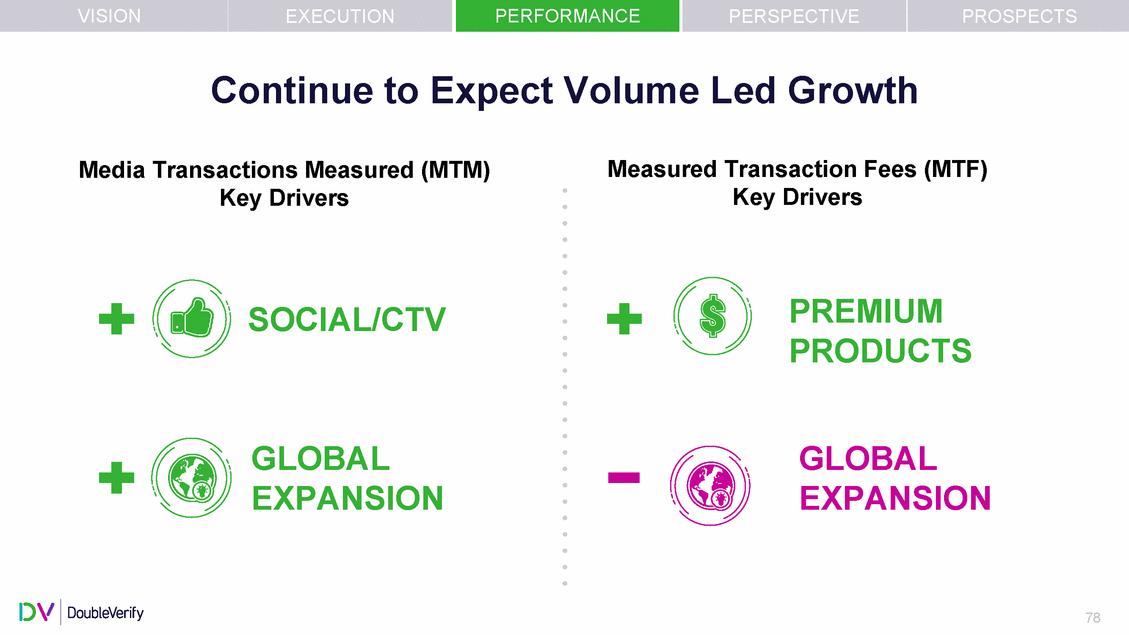
| VISION PERFORMANCE PROSPECTS EXECUTION PERSPECTIVE Continue to Expect Volume Led Growth Measured Transaction Fees (MTF) Media Transactions Measured (MTM) Key Drivers Key Drivers PREMIUM PRODUCTS SOCIAL/CTV GLOBAL EXPANSION GLOBAL EXPANSION 78 |
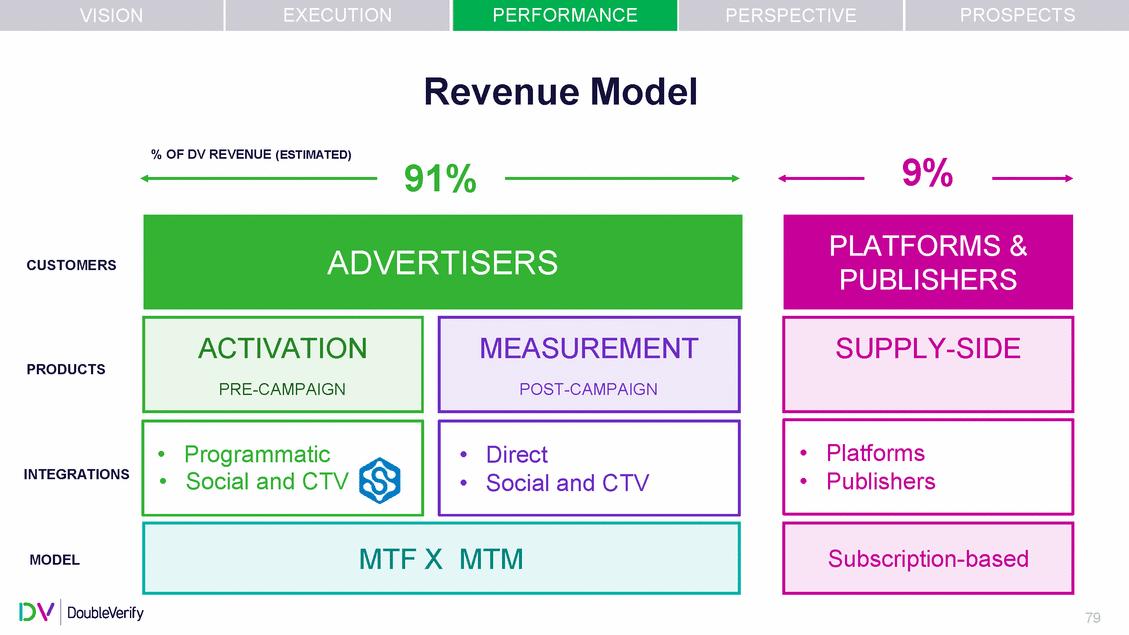
| VISION EXECUTION PERFORMANCE PERSPECTIVE PROSPECTS Revenue Model % OF DV REVENUE (ESTIMATED) 9% 91% CUSTOMERS PRODUCTS INTEGRATIONS MODEL 79 Subscription-based MTF XMTM •Platforms •Publishers •Direct •Social and CTV •Programmatic •Social and CTV SUPPLY-SIDE MEASUREMENT POST-CAMPAIGN ACTIVATION PRE-CAMPAIGN PLATFORMS & PUBLISHERS ADVERTISERS |
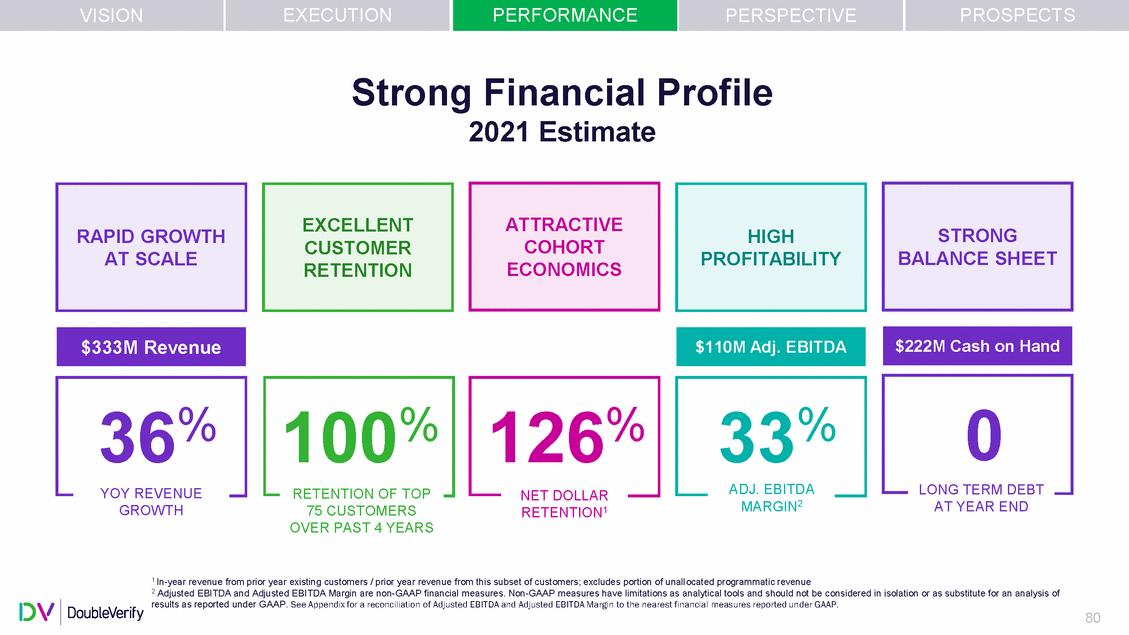
| VISION EXECUTION PERFORMANCE PERSPECTIVE PROSPECTS Strong Financial Profile 2021 Estimate BALANCE SHEET 100% 126% YOY REVENUE GROWTH RETENTION OF TOP NET DOLLAR RETENTION1 MARGIN2 AT YEAR END 75 CUSTOMERS OVER PAST 4 YEARS 1 In-year revenue from prior year existing customers / prior year revenue from this subset of customers; excludes portion of unallocated programmatic revenue 2 Adjusted EBITDA and Adjusted EBITDA Margin are non-GAAP financial measures. Non-GAAP measures have limitations as analytical tools and should not be considered in isolation or as substitute for an analysis of results as reported under GAAP. See Appendix for a reconciliation of Adjusted EBITDA and Adjusted EBITDA Margin to the nearest financial measures reported under GAAP. 80 0 LONG TERM DEBT 33% ADJ. EBITDA 36% $222M Cash on Hand $110M Adj. EBITDA $333M Revenue STRONG HIGH PROFITABILITY ATTRACTIVE COHORT ECONOMICS EXCELLENT CUSTOMER RETENTION RAPID GROWTH AT SCALE |
| Q&A 81 |
| CUSTOMER Julie dleman, Chief Commercial Officer 82 |
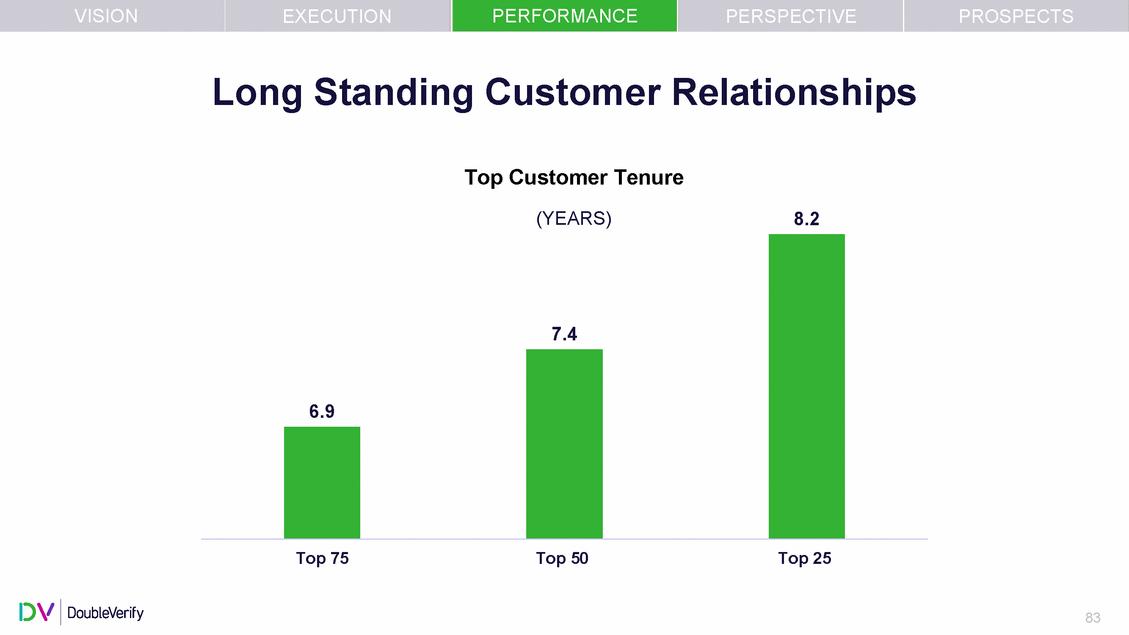
| VISION PERFORMANCE PROSPECTS EXECUTION PERSPECTIVE Long Standing Customer Relationships Top Customer Tenure (YEARS) 8.2 Top 75 Top 50 Top 25 83 7.4 6.9 |
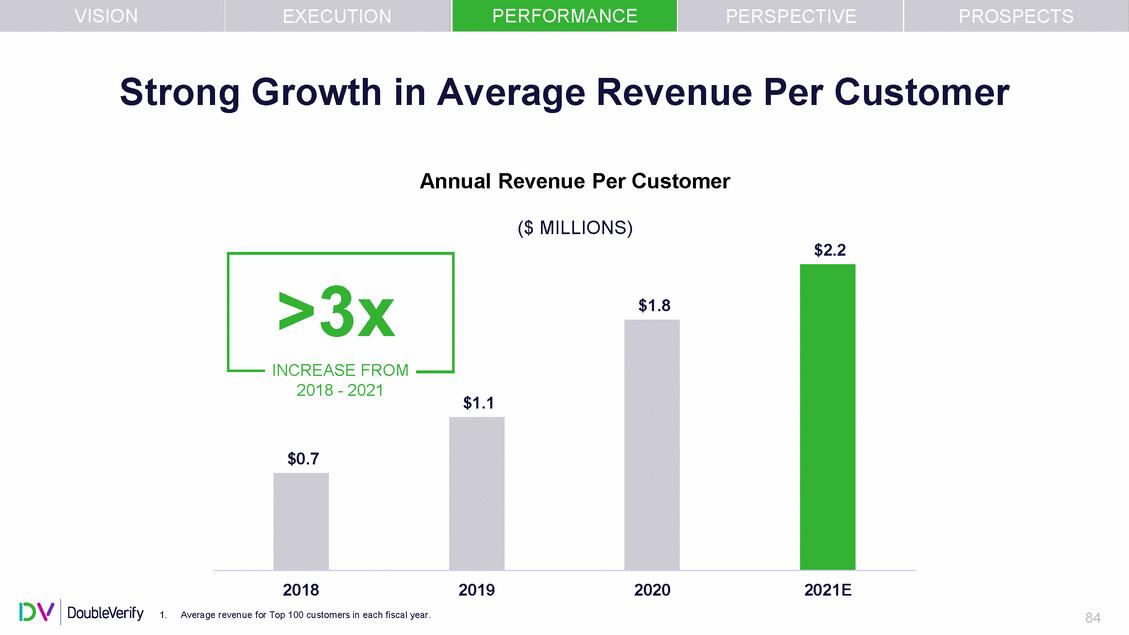
| VISION PERFORMANCE PROSPECTS EXECUTION PERSPECTIVE Strong Growth in Average Revenue Per Customer Annual Revenue Per Customer ($ MILLIONS) $2.2 $1.1 2018 1.Average revenue for Top 100 customers in each fiscal year. 2019 2020 2021E 84 $1.8 INCREASE FROM 2018 - 2021 $0.7 >3x |
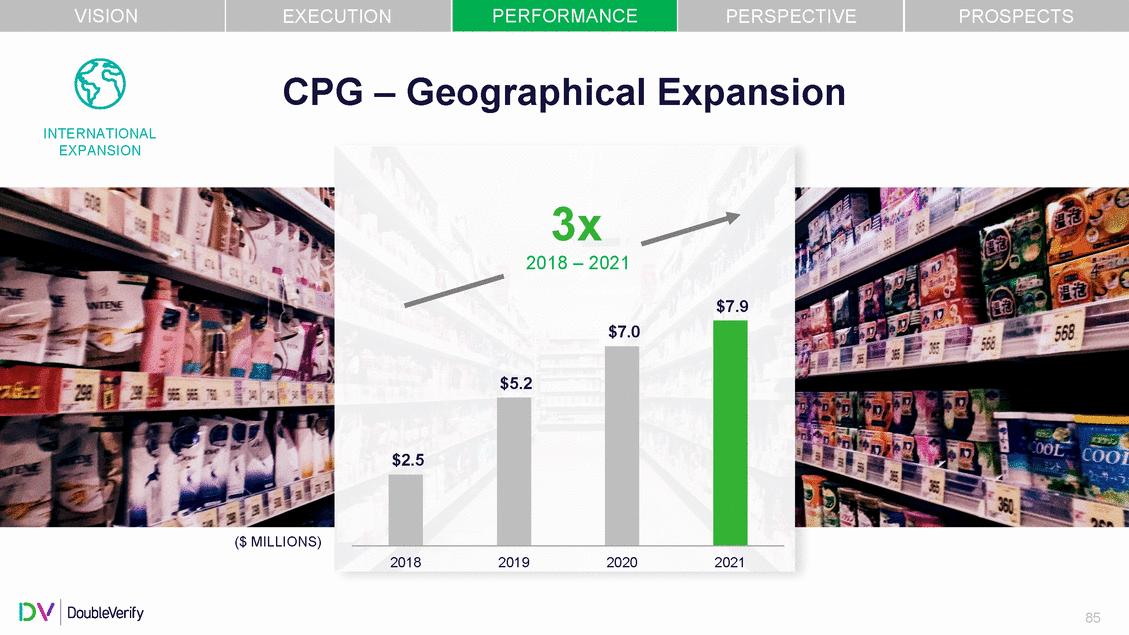
| VISION PERFORMANCE PROSPECTS EXECUTION PERSPECTIVE CPG – Geographical Expansion INTERNATIONAL EXPANSION 3x 2018 – 2021 $7.9 ($ MILLIONS) 2018 2019 2020 2021 85 $7.0 $5.2 $2.5 |
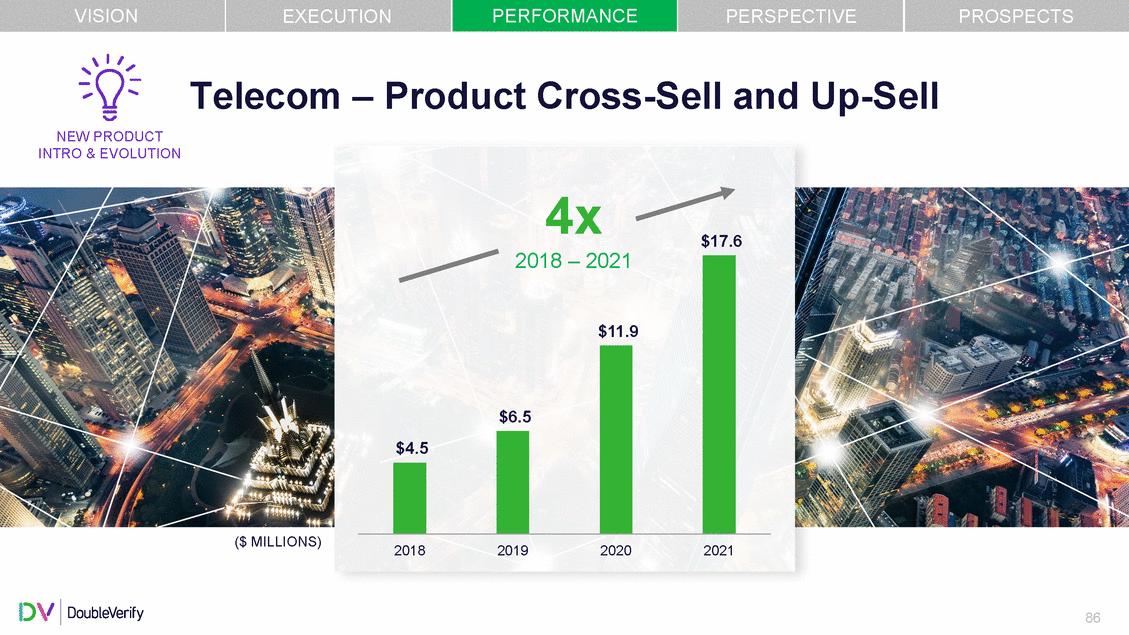
| VISION PERFORMANCE PROSPECTS EXECUTION PERSPECTIVE Telecom – Product Cross-Sell and Up-Sell NEW PRODUCT INTRO & EVOLUTION 4x $17.6 ($ MILLIONS) 2018 2019 2020 2021 86 2018 – 2021 $11.9 $6.5 $4.5 |
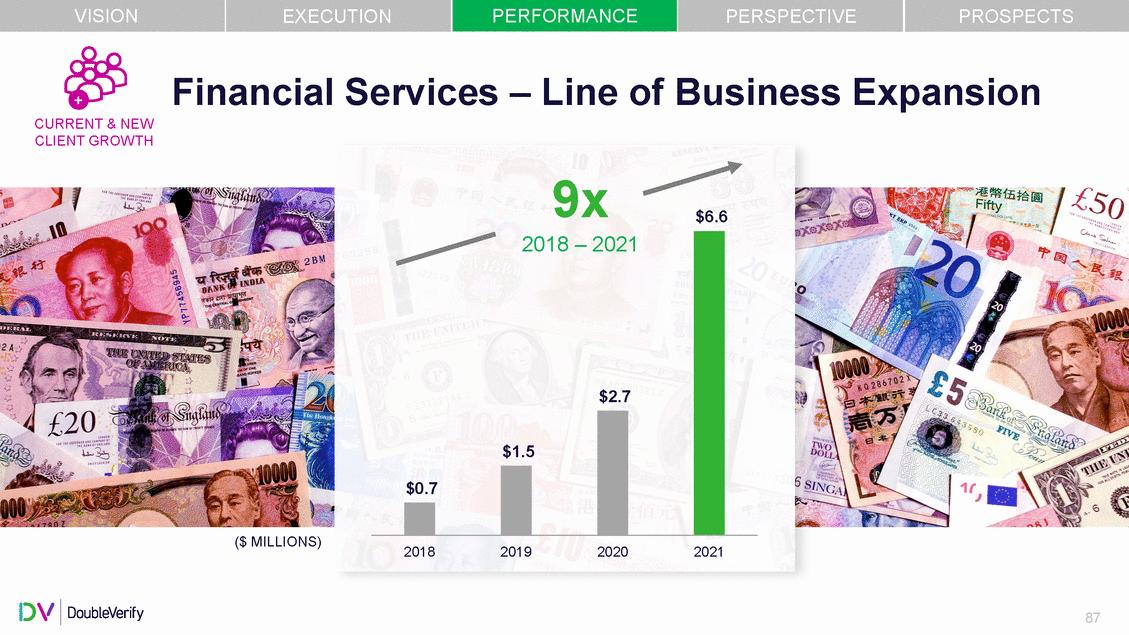
| VISION PERFORMANCE PROSPECTS EXECUTION PERSPECTIVE Financial Services – Line of Business Expansion + CURRENT & NEW CLIENT GROWTH 9x $6.6 ($ MILLIONS) 2018 2019 2020 2021 87 2018 – 2021 $2.7 $1.5 $0.7 |
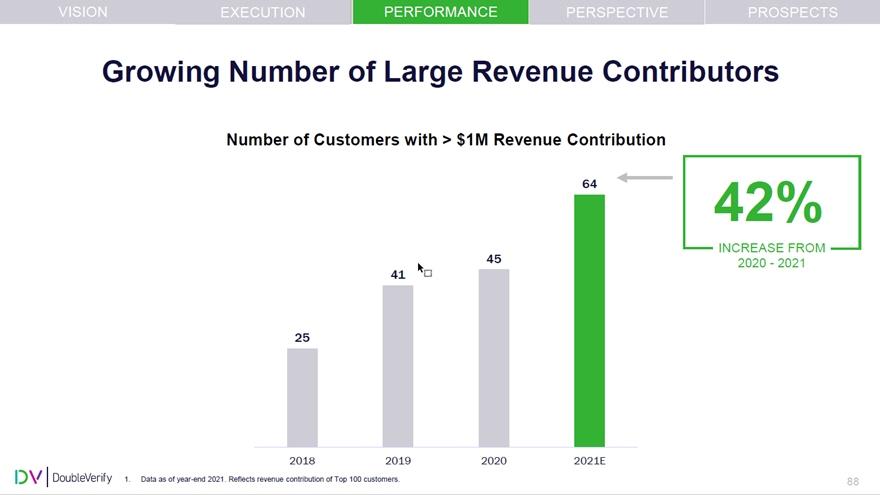
| VISION PERFORMANCE PROSPECTS EXECUTION PERSPECTIVE Growing Number of Large Revenue Contributors Number of Customers with > $1M Revenue Contribution 64 INCREASE FROM 2020 - 2021 2018 2019 2020 2021E 1.Data as of year-end 2021. Reflects revenue contribution of Top 100 customers. 88 45 41 25 42% |
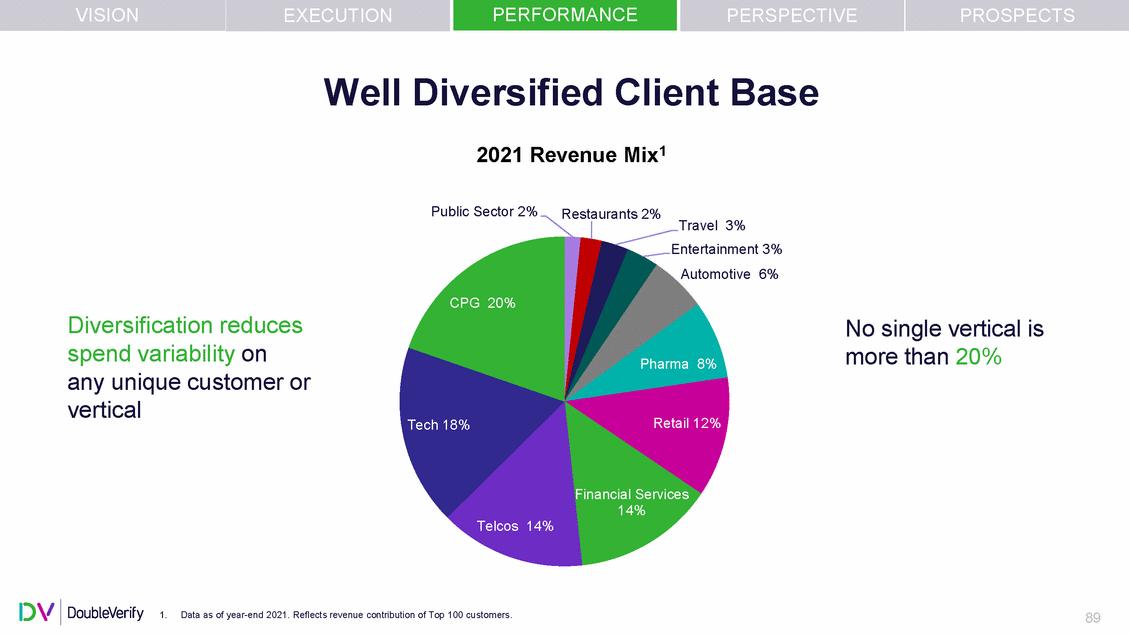
| PERFORMANCE VISION EXECUTION PERSPECTIVE PROSPECTS Well Diversified Client 2021 Revenue Mix1 Base Public Sector 2% Restaurants 2% Travel 3% Entertainment 3% Automotive 6% CPG 20% Diversification reduces No single vertical is spend variability on any unique customer or vertical more than 20% Pharma 8% Retail Tech 18% nancial Services 14% Telcos 14% 1.Data as of year-end 2021. Reflects revenue contribution of Top 100 customers. 89 |
| PERSPECTIVES Helen Lin, Chief Digital Officer, Publicis Jon Halvorson, SVP Consumer Experience and Digital Commerce, Mondelēz 90 |
| END GAME Mark Zagorski, CEO 91 |
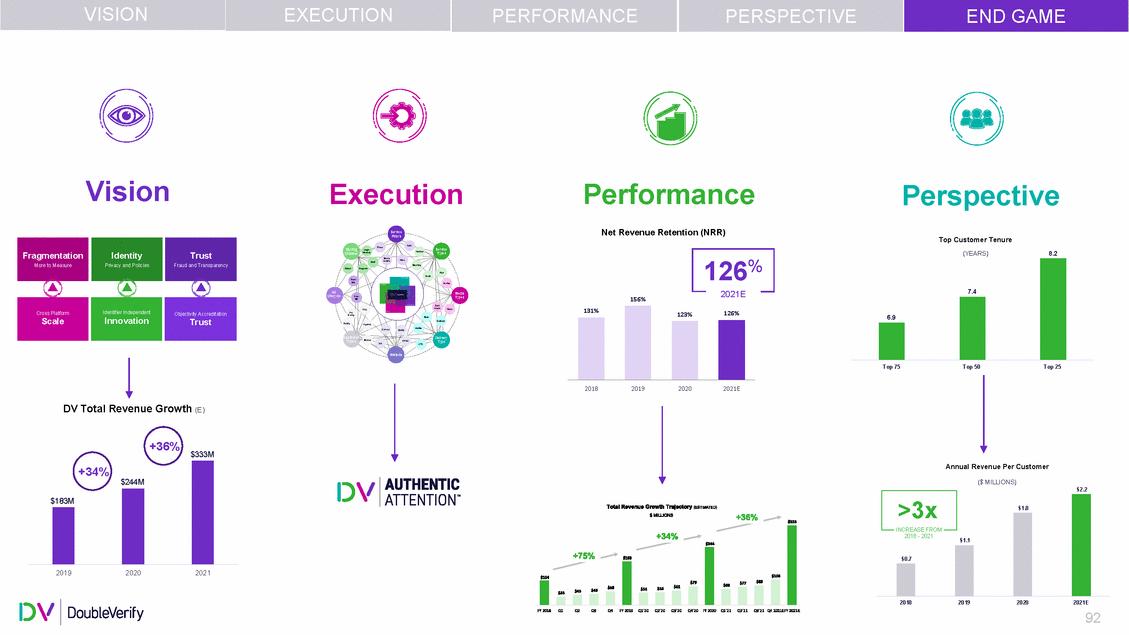
| VISION EXECUTION PERFORMANCE PERSPECTIVE END GAME Vision Execution Service Performance Net Revenue Retention (NRR) Perspective Top Customer Tenure Pillars Perf. Fraud Buying Inter-Service Types Monitor (YEARS) 8.2 Channel mediary Brand Safety % View. 126 PMP Blocking Direct Program Plan Avoid Post-Bid Native Ad Lifecycle 2021E Media Types Pre-Bid 156% Rich Media Plat. Video Ad. Exchg. Web Desktop Publis. Agency Mobile Canada EMEA Customer Types Delivery Type Brands APAC US CTV Markets Top 75 Top 50 Top 25 2018 2019 2020 2021E DV Total Revenue Growth (E) +36% $333M Annual Revenue Per Customer ($ MILLIONS) $2.2 $1.1 2019 2020 2021 2018 2019 2020 2021E 92 $1.8 INCREASE FROM 2018 - 2021 $0.7 >3x +34% $244M $183M 131% 123% 126% Cross Platform Scale Identifier Independent Innovation Objectivity Accreditation Trust 7.4 6.9 Fragmentation More to Measure Identity Privacy and Policies Trust Fraud and Transparency |
| DV breaks through measurement disruptions positioning usas a clear winner in the drive to deliver better advertising outcomes 93 |
| DV’s innovation driven, expanding leadership position has made us essential to the world’s biggest brands 94 |
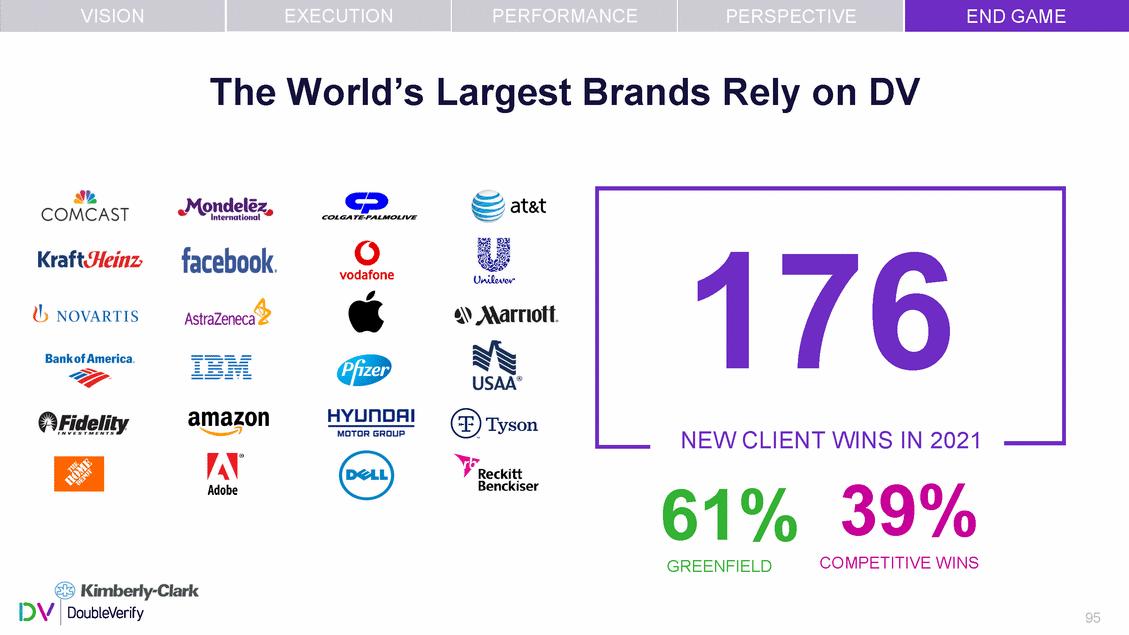
| VISION EXECUTION PERFORMANCE END GAME PERSPECTIVE The World’s Largest Brands Rely on DV 39% COMPETITIVE WINS 61% GREENFIELD 95 176 NEW CLIENT WINS IN 2021 |
| DV’s exceptional client value proposition has delivered market-leading growth 96 |
| And created a flywheel that will continue to drive success into the future 97 |
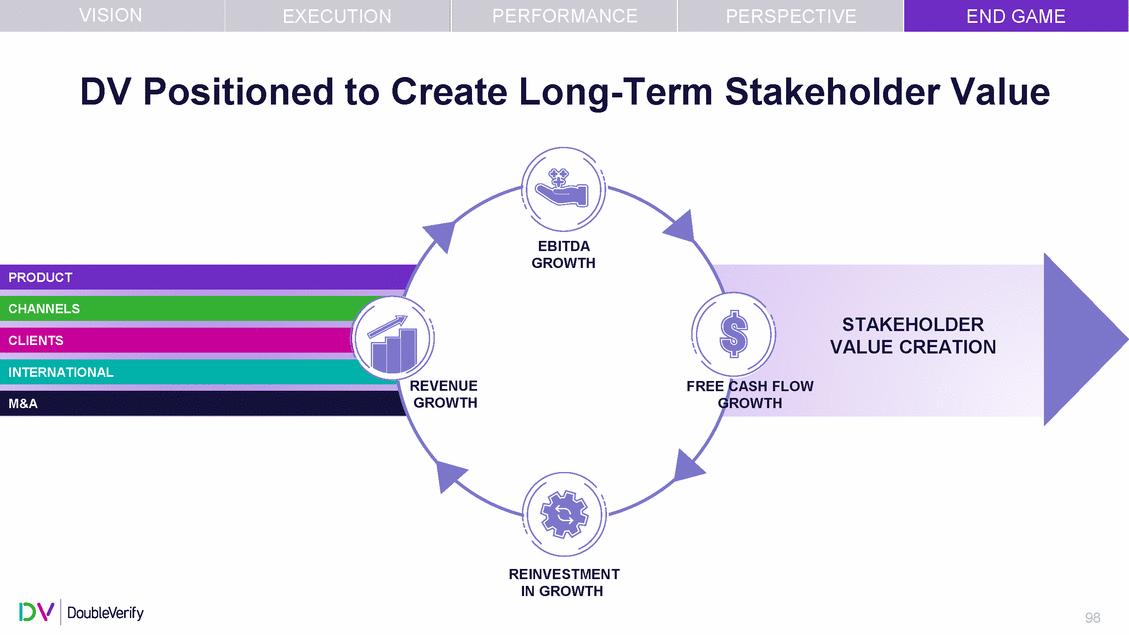
| VISION PERFORMANCE END GAME EXECUTION PERSPECTIVE DV Positioned to Create Long-Term Stakeholder Value EBITDA GROWTH PRODUCT CHANNELS STAKEHOLDER VALUE CREATION CLIENTS INTERNATIONAL REVENUE FREE CASH FLOW GROWTH GROWTH M&A REINVESTMENT IN GROWTH 98 |
| Maximizing value for all of our stakeholders 99 |
| Thank you. 100 |
| Appendix 101 |
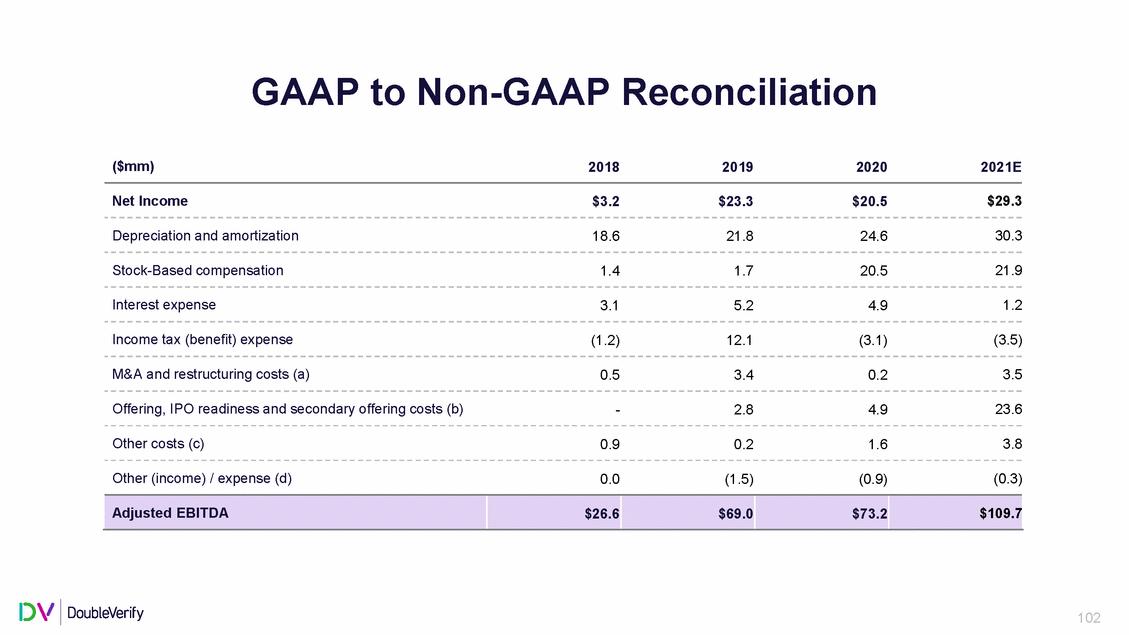
| GAAP to Non-GAAP Reconciliation 102 ($mm) 2018 2019 2020 2021E Net Income $3.2 $23.3 $20.5 $29.3 Depreciation and amortization 18.6 21.8 24.6 30.3 Stock-Based compensation 1.4 1.7 20.5 21.9 Interest expense 3.1 5.2 4.9 1.2 Income tax (benefit) expense (1.2) 12.1 (3.1) (3.5) M&A and restructuring costs (a) 0.5 3.4 0.2 3.5 Offering, IPO readiness and secondary offering costs (b) - 2.8 4.9 23.6 Other costs (c) 0.9 0.2 1.6 3.8 Other (income) / expense (d) 0.0 (1.5) (0.9) (0.3) Adjusted EBITDA $26.6 $69.0 $73.2 $109.7 |
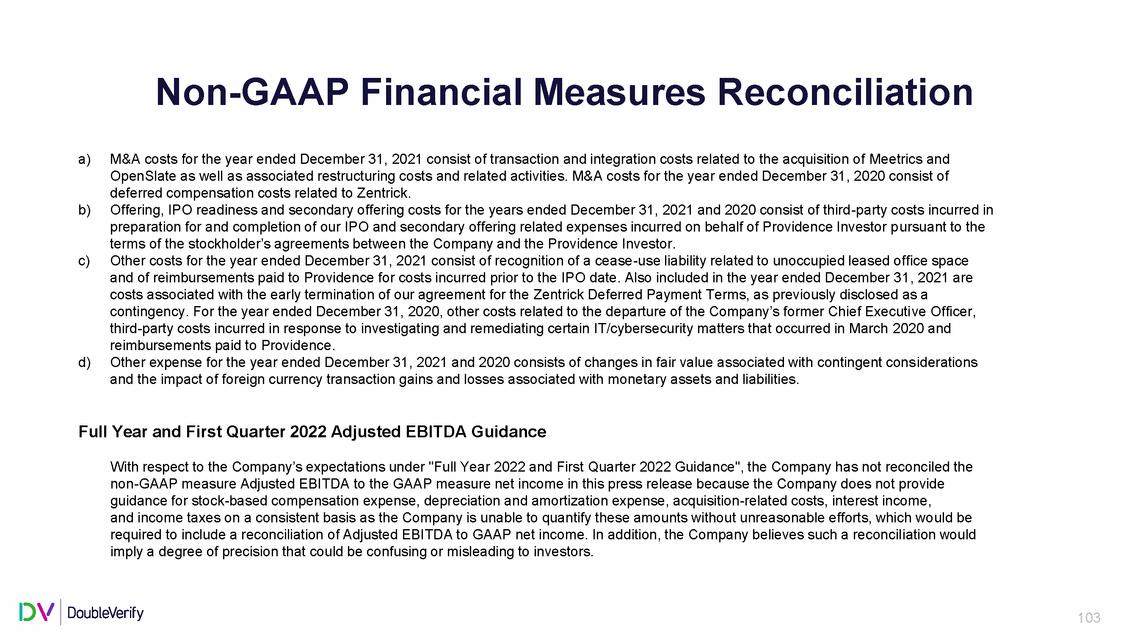
| Non-GAAP Financial Measures Reconciliation a) M&A costs for the year ended December 31, 2021 consist of transaction and integration costs related to the acquisition of Meetrics and OpenSlate as well as associated restructuring costs and related activities. M&A costs for the year ended December 31, 2020 consist of deferred compensation costs related to Zentrick. Offering, IPO readiness and secondary offering costs for the years ended December 31, 2021 and 2020 consist of third-party costs incurred in preparation for and completion of our IPO and secondary offering related expenses incurred on behalf of Providence Investor pursuant to the terms of the stockholder’s agreements between the Company and the Providence Investor. Other costs for the year ended December 31, 2021 consist of recognition of a cease-use liability related to unoccupied leased office space and of reimbursements paid to Providence for costs incurred prior to the IPO date. Also included in the year ended December 31, 2021 are costs associated with the early termination of our agreement for the Zentrick Deferred Payment Terms, as previously disclosed as a contingency. For the year ended December 31, 2020, other costs related to the departure of the Company’s former Chief Executive Officer, third-party costs incurred in response to investigating and remediating certain IT/cybersecurity matters that occurred in March 2020 and reimbursements paid to Providence. Other expense for the year ended December 31, 2021 and 2020 consists of changes in fair value associated with contingent considerations and the impact of foreign currency transaction gains and losses associated with monetary assets and liabilities. b) c) d) Full Year and First Quarter 2022 Adjusted EBITDA Guidance With respect to the Company’s expectations under "Full Year 2022 and First Quarter 2022 Guidance", the Company has not reconciled the non-GAAP measure Adjusted EBITDA to the GAAP measure net income in this press release because the Company does not provide guidance for stock-based compensation expense, depreciation and amortization expense, acquisition-related costs, interest income, and income taxes on a consistent basis as the Company is unable to quantify these amounts without unreasonable efforts, which would be required to include a reconciliation of Adjusted EBITDA to GAAP net income. In addition, the Company believes such a reconciliation would imply a degree of precision that could be confusing or misleading to investors. 103 |