00018199282022FYYesNoYesYes0.3331P5YP6Y1M6D0.33310.333false0001819928us-gaap:AllowanceForCreditLossMember2022-01-012022-12-310001819928us-gaap:AllowanceForCreditLossMember2021-01-012021-12-310001819928us-gaap:AllowanceForCreditLossMember2020-01-012020-12-310001819928us-gaap:AllowanceForCreditLossMember2022-12-310001819928us-gaap:AllowanceForCreditLossMember2021-12-310001819928us-gaap:AllowanceForCreditLossMember2020-12-310001819928us-gaap:AllowanceForCreditLossMember2019-12-3100018199282021-04-232021-04-230001819928us-gaap:AdditionalPaidInCapitalMemberus-gaap:PrivatePlacementMember2021-01-012021-12-310001819928us-gaap:AdditionalPaidInCapitalMemberus-gaap:IPOMember2021-01-012021-12-310001819928us-gaap:PrivatePlacementMember2021-01-012021-12-310001819928us-gaap:IPOMember2021-01-012021-12-310001819928us-gaap:TreasuryStockCommonMember2020-01-012020-12-310001819928dvh:ProvidenceViiU.s.HoldingsL.p.Memberus-gaap:PrivatePlacementMember2021-04-232021-04-230001819928dvh:ProvidenceViiU.s.HoldingsL.p.Memberus-gaap:OverAllotmentOptionMember2021-04-232021-04-230001819928us-gaap:OverAllotmentOptionMember2021-04-232021-04-230001819928us-gaap:CommonStockMemberus-gaap:PrivatePlacementMember2021-01-012021-12-310001819928us-gaap:CommonStockMemberus-gaap:IPOMember2021-01-012021-12-310001819928us-gaap:CommonStockMember2022-01-012022-12-310001819928us-gaap:CommonStockMember2020-01-012020-12-310001819928us-gaap:TreasuryStockCommonMember2021-01-012021-12-310001819928us-gaap:PreferredStockMember2021-01-012021-12-310001819928us-gaap:PreferredStockMember2020-01-012020-12-310001819928us-gaap:CommonStockMember2021-01-012021-12-310001819928srt:ParentCompanyMembersrt:ReportableLegalEntitiesMember2021-03-292021-03-2900018199282021-03-292021-03-290001819928us-gaap:RetainedEarningsMember2022-12-310001819928us-gaap:AociIncludingPortionAttributableToNoncontrollingInterestMember2022-12-310001819928us-gaap:AdditionalPaidInCapitalMember2022-12-310001819928us-gaap:RetainedEarningsMember2021-12-310001819928us-gaap:AociIncludingPortionAttributableToNoncontrollingInterestMember2021-12-310001819928us-gaap:AdditionalPaidInCapitalMember2021-12-310001819928us-gaap:RetainedEarningsMember2020-12-310001819928us-gaap:AociIncludingPortionAttributableToNoncontrollingInterestMember2020-12-310001819928us-gaap:AdditionalPaidInCapitalMember2020-12-310001819928us-gaap:RetainedEarningsMember2019-12-310001819928us-gaap:AociIncludingPortionAttributableToNoncontrollingInterestMember2019-12-310001819928us-gaap:AdditionalPaidInCapitalMember2019-12-310001819928dvh:TigerGlobalManagementLlcMemberus-gaap:PrivatePlacementMember2021-04-090001819928us-gaap:TreasuryStockCommonMember2022-12-310001819928us-gaap:CommonStockMember2022-12-310001819928us-gaap:TreasuryStockCommonMember2021-12-310001819928us-gaap:CommonStockMember2021-12-310001819928us-gaap:TreasuryStockCommonMember2020-12-310001819928us-gaap:PreferredStockMember2020-12-310001819928us-gaap:CommonStockMember2020-12-310001819928us-gaap:CommonStockMember2019-12-310001819928dvh:SellingStockholdersMemberdvh:PerformanceAndMarketBasedSharesMemberdvh:SecondaryOfferingsMember2021-11-192021-11-190001819928dvh:PerformanceAndMarketBasedSharesMember2022-12-310001819928us-gaap:EmployeeStockOptionMemberdvh:OmnibusEquityIncentivePlan2021Memberus-gaap:SubsequentEventMember2023-02-152023-02-150001819928dvh:OmnibusEquityIncentivePlan2021Member2021-04-190001819928dvh:EquityIncentiveProgramMember2017-09-200001819928srt:MinimumMember2021-01-012021-12-310001819928srt:MaximumMember2021-01-012021-12-310001819928srt:MinimumMember2020-01-012020-12-310001819928dvh:EquityIncentiveProgramMember2022-01-012022-12-310001819928us-gaap:RestrictedStockUnitsRSUMember2021-12-310001819928us-gaap:RestrictedStockUnitsRSUMember2021-01-012021-12-310001819928us-gaap:RestrictedStockUnitsRSUMember2020-01-012020-12-310001819928us-gaap:RestrictedStockUnitsRSUMemberdvh:OmnibusEquityIncentivePlan2021Memberus-gaap:SubsequentEventMember2023-02-152023-02-150001819928dvh:PerformanceAndMarketBasedSharesMember2022-01-012022-12-310001819928us-gaap:EmployeeStockOptionMember2022-01-012022-12-310001819928dvh:SupplySideCustomerMember2022-01-012022-12-310001819928dvh:AdvertisersProgrammaticMember2022-01-012022-12-310001819928dvh:AdvertisersDirectMember2022-01-012022-12-310001819928dvh:SupplySideCustomerMember2021-01-012021-12-310001819928dvh:AdvertisersProgrammaticMember2021-01-012021-12-310001819928dvh:AdvertisersDirectMember2021-01-012021-12-310001819928dvh:SupplySideCustomerMember2020-01-012020-12-310001819928dvh:AdvertisersProgrammaticMember2020-01-012020-12-310001819928dvh:AdvertisersDirectMember2020-01-012020-12-310001819928srt:MinimumMemberus-gaap:OfficeEquipmentMember2022-01-012022-12-310001819928srt:MaximumMemberus-gaap:OfficeEquipmentMember2022-01-012022-12-310001819928us-gaap:ComputerEquipmentMember2022-01-012022-12-310001819928us-gaap:SoftwareAndSoftwareDevelopmentCostsMember2022-12-310001819928us-gaap:LeaseholdImprovementsMember2022-12-310001819928us-gaap:FurnitureAndFixturesMember2022-12-310001819928us-gaap:SoftwareAndSoftwareDevelopmentCostsMember2021-12-310001819928us-gaap:LeaseholdImprovementsMember2021-12-310001819928us-gaap:FurnitureAndFixturesMember2021-12-310001819928us-gaap:SeriesAPreferredStockMemberdvh:PreferredPurchaseAgreementMember2020-10-272020-10-270001819928dvh:PreferredPurchaseAgreementMember2020-10-272020-10-270001819928dvh:ZentrickMember2021-01-012021-12-310001819928dvh:ZentrickMember2020-01-012020-12-310001819928dvh:LeikiMember2020-01-012020-12-310001819928dvh:ZentrickNvMember2022-02-162022-02-160001819928us-gaap:AociIncludingPortionAttributableToNoncontrollingInterestMember2022-01-012022-12-310001819928us-gaap:AociIncludingPortionAttributableToNoncontrollingInterestMember2021-01-012021-12-310001819928srt:ScenarioPreviouslyReportedMember2021-12-310001819928dvh:OutriggerMediaMemberus-gaap:StateAndLocalJurisdictionMember2022-12-310001819928dvh:OutriggerMediaMemberus-gaap:DomesticCountryMember2022-12-310001819928dvh:MeetricsGmbhMember2022-12-310001819928srt:RestatementAdjustmentMemberus-gaap:AccountingStandardsUpdate201602Member2022-01-0100018199282022-01-010001819928us-gaap:RetainedEarningsMember2022-01-012022-12-310001819928us-gaap:RetainedEarningsMember2021-01-012021-12-310001819928us-gaap:RetainedEarningsMember2020-01-012020-12-310001819928us-gaap:RevolvingCreditFacilityMember2022-12-310001819928us-gaap:RevolvingCreditFacilityMember2021-12-310001819928us-gaap:LetterOfCreditMember2020-10-010001819928srt:MinimumMember2020-10-012020-10-010001819928srt:MaximumMember2020-10-012020-10-010001819928srt:MinimumMember2022-12-310001819928srt:MaximumMember2022-12-310001819928us-gaap:ForeignCountryMember2022-01-012022-12-310001819928us-gaap:DomesticCountryMember2022-01-012022-12-310001819928us-gaap:ForeignCountryMember2021-01-012021-12-310001819928us-gaap:DomesticCountryMember2021-01-012021-12-310001819928us-gaap:ForeignCountryMember2020-01-012020-12-310001819928us-gaap:DomesticCountryMember2020-01-012020-12-310001819928srt:MinimumMemberus-gaap:TrademarksMember2022-01-012022-12-310001819928srt:MinimumMemberus-gaap:TechnologyBasedIntangibleAssetsMember2022-01-012022-12-310001819928srt:MinimumMemberus-gaap:CustomerRelationshipsMember2022-01-012022-12-310001819928srt:MaximumMemberus-gaap:TrademarksMember2022-01-012022-12-310001819928srt:MaximumMemberus-gaap:TechnologyBasedIntangibleAssetsMember2022-01-012022-12-310001819928srt:MaximumMemberus-gaap:CustomerRelationshipsMember2022-01-012022-12-310001819928dvh:OutriggerMediaMemberus-gaap:DevelopedTechnologyRightsMember2021-11-222021-11-220001819928dvh:OutriggerMediaMemberus-gaap:CustomerRelationshipsMember2021-11-222021-11-220001819928dvh:MeetricsGmbhMemberus-gaap:TrademarksMember2021-08-312021-08-310001819928dvh:MeetricsGmbhMemberus-gaap:NoncompeteAgreementsMember2021-08-312021-08-310001819928dvh:MeetricsGmbhMemberus-gaap:DevelopedTechnologyRightsMember2021-08-312021-08-310001819928dvh:MeetricsGmbhMemberus-gaap:CustomerRelationshipsMember2021-08-312021-08-310001819928us-gaap:TrademarksAndTradeNamesMember2022-01-012022-12-310001819928us-gaap:NoncompeteAgreementsMember2022-01-012022-12-310001819928us-gaap:DevelopedTechnologyRightsMember2022-01-012022-12-310001819928us-gaap:CustomerRelationshipsMember2022-01-012022-12-310001819928us-gaap:TrademarksAndTradeNamesMember2022-12-310001819928us-gaap:NoncompeteAgreementsMember2022-12-310001819928us-gaap:DevelopedTechnologyRightsMember2022-12-310001819928us-gaap:CustomerRelationshipsMember2022-12-310001819928us-gaap:TrademarksAndTradeNamesMember2021-12-310001819928us-gaap:NoncompeteAgreementsMember2021-12-310001819928us-gaap:DevelopedTechnologyRightsMember2021-12-310001819928us-gaap:CustomerRelationshipsMember2021-12-310001819928us-gaap:ComputerEquipmentMember2022-12-310001819928us-gaap:ComputerEquipmentMember2021-12-310001819928dvh:BusinessAcquisitionContingentConsiderationMember2021-12-310001819928dvh:BusinessAcquisitionContingentConsiderationMember2020-12-310001819928dvh:BusinessAcquisitionContingentConsiderationMember2019-12-310001819928dvh:BusinessAcquisitionContingentConsiderationMember2022-01-012022-12-310001819928dvh:BusinessAcquisitionContingentConsiderationMember2021-01-012021-12-310001819928dvh:BusinessAcquisitionContingentConsiderationMember2020-01-012020-12-310001819928us-gaap:RestrictedStockUnitsRSUMember2022-01-012022-12-310001819928us-gaap:RestrictedStockUnitsRSUMember2022-12-310001819928us-gaap:StateAndLocalJurisdictionMember2022-12-310001819928us-gaap:DomesticCountryMember2022-12-310001819928us-gaap:RevolvingCreditFacilityMember2020-10-010001819928us-gaap:RevolvingCreditFacilityMemberus-gaap:LondonInterbankOfferedRateLIBORMember2020-10-012020-10-010001819928us-gaap:IPOMember2021-04-230001819928us-gaap:IPOMember2022-12-310001819928dvh:EmployeeStockPurchasePlan2021Member2021-03-310001819928srt:ParentCompanyMembersrt:ReportableLegalEntitiesMember2020-12-310001819928srt:ParentCompanyMembersrt:ReportableLegalEntitiesMember2019-12-310001819928us-gaap:FairValueInputsLevel1Memberus-gaap:FairValueMeasurementsRecurringMember2022-12-310001819928dvh:MoneyMarketFundsAndTimeDepositsMemberus-gaap:FairValueInputsLevel1Member2022-12-310001819928us-gaap:FairValueInputsLevel1Memberus-gaap:FairValueMeasurementsRecurringMember2021-12-310001819928dvh:MoneyMarketFundsAndTimeDepositsMemberus-gaap:FairValueInputsLevel1Member2021-12-310001819928dvh:OutriggerMediaMemberus-gaap:DevelopedTechnologyRightsMember2021-11-220001819928dvh:OutriggerMediaMemberus-gaap:CustomerRelationshipsMember2021-11-220001819928dvh:MeetricsGmbhMemberus-gaap:TrademarksMember2021-08-310001819928dvh:MeetricsGmbhMemberus-gaap:NoncompeteAgreementsMember2021-08-310001819928dvh:MeetricsGmbhMemberus-gaap:DevelopedTechnologyRightsMember2021-08-310001819928dvh:MeetricsGmbhMemberus-gaap:CustomerRelationshipsMember2021-08-310001819928dvh:OutriggerMediaMember2022-12-310001819928dvh:BusinessCombinationContingentConsiderationLiabilityMemberus-gaap:MeasurementInputDiscountRateMember2021-12-310001819928dvh:BusinessCombinationContingentConsiderationLiabilityMemberdvh:MeasurementInputRevenueVolatilityMember2021-12-310001819928dvh:BusinessCombinationContingentConsiderationLiabilityMemberus-gaap:MeasurementInputDiscountRateMember2020-12-310001819928dvh:BusinessCombinationContingentConsiderationLiabilityMemberdvh:MeasurementInputRevenueVolatilityMember2020-12-310001819928us-gaap:FairValueInputsLevel3Memberus-gaap:FairValueMeasurementsRecurringMember2021-12-310001819928us-gaap:FairValueMeasurementsRecurringMember2021-12-310001819928dvh:ZentrickNvMember2021-01-012021-12-310001819928dvh:ZentrickNvMember2020-01-012020-12-310001819928dvh:MeetricsGmbhMember2022-01-012022-12-310001819928dvh:OutriggerMediaMember2021-01-012021-12-310001819928dvh:MeetricsGmbhMember2021-01-012021-12-310001819928srt:ParentCompanyMembersrt:ReportableLegalEntitiesMemberdvh:DoubleverifyInc.Member2017-08-180001819928dvh:DoubleverifyInc.Member2017-08-180001819928dvh:ZentrickNvMember2021-12-310001819928us-gaap:ComputerSoftwareIntangibleAssetMember2022-01-012022-12-310001819928us-gaap:ComputerSoftwareIntangibleAssetMember2021-01-012021-12-310001819928us-gaap:ComputerSoftwareIntangibleAssetMember2020-01-012020-12-3100018199282020-12-3100018199282019-12-310001819928srt:MaximumMemberdvh:EmployeeStockPurchasePlan2021Member2022-01-012022-12-310001819928us-gaap:SellingAndMarketingExpenseMember2022-01-012022-12-310001819928us-gaap:ResearchAndDevelopmentExpenseMember2022-01-012022-12-310001819928srt:MaximumMemberdvh:EmployeeStockPurchasePlan2021Member2021-01-012021-12-310001819928us-gaap:SellingAndMarketingExpenseMember2021-01-012021-12-310001819928us-gaap:ResearchAndDevelopmentExpenseMember2021-01-012021-12-310001819928dvh:PerformanceAndMarketBasedSharesMember2021-01-012021-12-310001819928us-gaap:RestrictedStockUnitsRSUMemberus-gaap:GeneralAndAdministrativeExpenseMember2020-01-012020-12-310001819928us-gaap:SellingAndMarketingExpenseMember2020-01-012020-12-310001819928us-gaap:ResearchAndDevelopmentExpenseMember2020-01-012020-12-310001819928srt:MaximumMember2020-01-012020-12-310001819928us-gaap:AdditionalPaidInCapitalMember2022-01-012022-12-310001819928us-gaap:AdditionalPaidInCapitalMember2021-01-012021-12-310001819928dvh:OutriggerMediaMember2021-11-222021-11-220001819928dvh:MeetricsGmbhMember2021-08-312021-08-310001819928srt:ParentCompanyMembersrt:ReportableLegalEntitiesMember2022-12-310001819928srt:ParentCompanyMembersrt:ReportableLegalEntitiesMember2021-12-310001819928us-gaap:TreasuryStockCommonMember2022-01-012022-12-310001819928us-gaap:GeneralAndAdministrativeExpenseMemberus-gaap:IPOMember2021-01-012021-12-310001819928us-gaap:GeneralAndAdministrativeExpenseMemberus-gaap:IPOMember2020-01-012020-12-310001819928dvh:OmnibusEquityIncentivePlan2021Member2021-04-192021-04-190001819928dvh:EmployeeStockPurchasePlan2021Member2021-03-012021-03-310001819928dvh:OutriggerMediaMember2022-01-012022-12-310001819928dvh:TigerGlobalManagementLlcMemberus-gaap:PrivatePlacementMember2021-04-092021-04-090001819928srt:ParentCompanyMembersrt:ReportableLegalEntitiesMember2020-01-012020-12-310001819928us-gaap:AociIncludingPortionAttributableToNoncontrollingInterestMember2020-01-012020-12-310001819928stpr:NYdvh:OperatingLeaseOfficeSpaceInDomesticAndForeignMember2021-12-310001819928us-gaap:GeneralAndAdministrativeExpenseMember2022-01-012022-12-310001819928us-gaap:GeneralAndAdministrativeExpenseMember2021-01-012021-12-310001819928us-gaap:GeneralAndAdministrativeExpenseMember2020-01-012020-12-310001819928dvh:PerformanceAndMarketBasedSharesMember2020-01-012020-12-310001819928srt:ParentCompanyMembersrt:ReportableLegalEntitiesMember2022-01-012022-12-310001819928srt:ParentCompanyMembersrt:ReportableLegalEntitiesMember2021-01-012021-12-310001819928us-gaap:IPOMember2021-04-232021-04-230001819928srt:MaximumMemberdvh:ZentrickNvMember2021-01-012021-12-310001819928srt:MaximumMemberdvh:ZentrickNvMember2020-01-012020-12-310001819928us-gaap:OtherCurrentLiabilitiesMemberdvh:ZentrickNvMember2022-12-310001819928us-gaap:OtherCurrentLiabilitiesMemberdvh:ZentrickNvMember2021-12-310001819928dvh:BusinessCombinationSecondTrancheOfHoldbackPaymentsMemberdvh:ZentrickNvMember2019-02-152019-02-150001819928dvh:BusinessCombinationFirstTrancheOfHoldbackPaymentsMemberdvh:ZentrickNvMember2019-02-152019-02-150001819928dvh:OutriggerMediaMember2021-11-220001819928dvh:MeetricsGmbhMember2021-08-310001819928dvh:ZentrickNvMember2019-02-152019-02-150001819928dvh:ZentrickNvMember2019-02-1500018199282021-01-012021-12-310001819928us-gaap:AdditionalPaidInCapitalMember2020-01-012020-12-3100018199282020-01-012020-12-3100018199282022-12-3100018199282021-12-3100018199282022-06-3000018199282023-02-2100018199282022-01-012022-12-31xbrli:sharesiso4217:USDdvh:Milestonedvh:componentxbrli:pureiso4217:USDxbrli:sharesdvh:segment

Table of Contents

UNITED STATES

SECURITIES AND EXCHANGE COMMISSION

Washington, D.C. 20549

FORM 10-K

(Mark One)

ANNUAL REPORT PURSUANT TO SECTION 13 OR 15(d) OF THE SECURITIES EXCHANGE ACT OF 1934

For the fiscal year ended December 31, 2022

OR

TRANSITION REPORT PURSUANT TO SECTION 13 OR 15(d) OF THE SECURITIES EXCHANGE ACT OF 1934 FOR THE TRANSITION PERIOD FROM                      TO                     

Commission File Number 001-40349

DoubleVerify Holdings, Inc.

(Exact name of Registrant as specified in its Charter)

Delaware

82-2714562

(State or other jurisdiction
of incorporation or organization)

(I.R.S. Employer
Identification No.)

462 Broadway

New York, NY 10013

(Address of principal executive offices including zip code)

Registrant’s telephone number, including area code: (212631-2111

Securities registered pursuant to Section 12(b) of the Act:

Title of each class

Trading Symbol(s)

Name of the exchange on which registered

Common Stock, par value $0.001 per share

DV

New York Stock Exchange

Securities registered pursuant to Section 12(g) of the Act: None

Indicate by check mark if the Registrant is a well-known seasoned issuer, as defined in Rule 405 of the Securities Act.  YES     NO  

Indicate by check mark if the Registrant is not required to file reports pursuant to Section 13 or 15(d) of the Act.  YES      NO  

Indicate by check mark whether the Registrant: (1) has filed all reports required to be filed by Section 13 or 15(d) of the Securities Exchange Act of 1934 during the preceding 12 months (or for such shorter period that the Registrant was required to file such reports), and (2) has been subject to such filing requirements for the past 90 days.  YES      NO  

Indicate by check mark whether the Registrant has submitted electronically every Interactive Data File required to be submitted pursuant to Rule 405 of Regulation S-T (§232.405 of this chapter) during the preceding 12 months (or for such shorter period that the Registrant was required to submit such files).  YES      NO  

Indicate by check mark whether the Registrant is a large accelerated filer, an accelerated filer, a non-accelerated filer, a smaller reporting company, or an emerging growth company. See the definitions of “large accelerated filer”, “accelerated filer”, “smaller reporting company,” and “emerging growth company” in Rule 12b-2 of the Exchange Act.

Large accelerated filer

Accelerated filer


Non-accelerated filer


Smaller reporting company


Emerging growth company


If an emerging growth company, indicate by check mark if the registrant has elected not to use the extended transition period for complying with any new or revised financial accounting standards provided pursuant to Section 13(a) of the Exchange Act.

Indicate by check mark whether the Registrant has filed a report on and attestation to its management’s assessment of the effectiveness of its internal control over financial reporting under Section 404(b) of the Sarbanes-Oxley Act (15 U.S.C. 7262(b)) by the registered public accounting firm that prepared or issued its audit report.

If securities are registered pursuant to Section 12(b) of the Act, indicate by check mark whether the financial statements of the registrant included in the filing reflect the correction of an error to previously issued financial statements.

Indicate by check mark whether any of those error corrections are restatements that required a recovery analysis of incentive-based compensation received by any of the registrant’s executive officers during the relevant recovery period pursuant to §240.10D-1(b).

Indicate by check mark whether the Registrant is a shell company (as defined in Rule 12b-2 of the Exchange Act).   YES      NO  

The aggregate market value of the Registrant’s Common Stock held by non-affiliates of the Registrant as of June 30, 2022, the last business day of the Registrant’s most recently completed second fiscal quarter, was approximately $1,858,366,041 based upon the closing price reported for such date on the New York Stock Exchange (“NYSE”). The number of shares of Registrant’s Common Stock outstanding as of February 21, 2023 was 165,537,166.

DOCUMENTS INCORPORATED BY REFERENCE

Portions of the Registrant’s proxy statement for its 2023 annual meeting of stockholders are incorporated herein by reference in Part III of this Annual Report on Form 10-K to the extent stated herein. Such proxy statement will be filed with the Securities and Exchange Commission within 120 days of the Registrant’s fiscal year ended December 31, 2022.

Table of Contents

Table of Contents

Special Note About Forward-Looking Statements

Market and Industry Data

Service Marks Trademarks and Trade Names

PART I

6

Item 1. Business

6

Item 1A. Risk Factors

22

Item 1B. Unresolved Staff Comments

46

Item 2. Properties

46

Item 3. Legal Proceedings

46

Item 4. Mine Safety Disclosures

46

PART II

47

Item 5. Market for Registrant’s Common Equity, Related Stockholder Matters and Issuer Purchases of Equity Securities

47

Item 6. [Reserved]

48

Item 7. Management’s Discussion and Analysis of Financial Condition and Results of Operations

49

Item 7A. Quantitative and Qualitative Disclosure about Market Risk

68

Item 8. Financial Statements and Supplementary Data

69

Item 9. Changes in and Disagreements with Accountants on Accounting and Financial Disclosure

115

Item 9A. Controls and Procedures

115

Item 9B. Other Information

115

Item 9C. Disclosure Regarding Foreign Jurisdictions that Prevent Inspections

116

PART III

117

Item 10. Directors, Executive Officers and Corporate Governance

117

Item 11. Executive Compensation

117

Item 12. Security Ownership of Certain Beneficial Owners and Management and Related Stockholder Matters

117

Item 13. Certain Relationships and Related Transactions, and Director Independence

117

Item 14. Principal Accountant Fees and Services

117

PART IV

118

Item 15. Exhibits and Financial Statement Schedules

118

Item 16. Form 10-K Summary

121

Signatures

122

1

Table of Contents

SPECIAL NOTE ABOUT FORWARD-LOOKING STATEMENTS

This Annual Report on Form 10-K contains forward-looking statements within the meaning of Section 27A of the Securities Act of 1933, as amended (the “Securities Act”), and Section 21E of the Securities Exchange Act of 1934, as amended (the “Exchange Act”). Some of the forward- looking statements can be identified by the use of forward-looking terms such as “believes,” “expects,” “may,” “will,” “shall,” “should,” “would,” “could,” “seeks,” “aims,” “projects,” “intends,” “plans,” “estimates,” “anticipates” or other comparable terms. Forward-looking statements include, without limitation, all matters that are not historical facts. They appear in a number of places throughout this Annual Report on Form 10-K and include, without limitation, statements regarding our intentions, beliefs, assumptions or current expectations concerning, among other things, our financial position; results of operations; industry outlook; and growth strategies or expectations.

Forward-looking statements are subject to known and unknown risks and uncertainties, many of which may be beyond our control. We caution you that forward-looking statements are not guarantees of future performance or outcomes and that actual performance and outcomes, including, without limitation, our actual results of operations, financial condition and liquidity, and the development of the market in which we operate, may differ materially from those made in or suggested by the forward-looking statements contained in this Annual Report on Form 10-K. In addition, even if our results of operations, financial condition and cash flows, and the development of the market in which we operate, are consistent with the forward-looking statements contained in this Annual Report on Form 10-K, those results or developments may not be indicative of results or developments in subsequent periods. A number of important factors, including, without limitation, the risks and uncertainties discussed under the captions “Risk Factors” and “Management’s Discussion and Analysis of Financial Condition and Results of Operations” in this Annual Report on Form 10-K could cause actual results and outcomes to differ materially from those reflected in the forward-looking statements. These factors include, without limitation:

our ability to respond to technological developments and evolving industry standards, which may make our solutions obsolete or less competitive;

our ability to compete in our highly competitive market;

our ability to retain existing customers, obtain new customers and generate revenue from new customers;

system failures, security breaches, cyberattacks or natural disasters that could interrupt the operation of our platform and data centers;

our reliance on demand- and supply-side advertising platforms, ad servers and social platforms to accept and integrate with our technology;

economic downturns and unstable market conditions;

our ability to integrate businesses acquired;

acquired businesses may disrupt our business, expose us to unanticipated liabilities, dilute stockholder value or divert management attention;

our ability to accurately and timely collect payments from our customers and integration partners;

2

Table of Contents

defects, errors or inaccuracies associated with our solutions;

our long sales cycles, which can result in significant time between initial contact with a prospect and execution of a contractual agreement, making it difficult to project when, if at all, we will generate revenue from new customers;

our ability to retain our senior management team and other key personnel and to hire additional qualified personnel;

scrutiny of our environmental, social and governance practices and meeting our stakeholders’ evolving expectations relating to such practices;

the application, interpretation, and enforcement of data privacy legislation and regulation on digital advertising and privacy and data protection;

the impact of public criticism of digital advertising technology on our business, including digital advertising on social media platforms;

the assertion of third-party intellectual property rights against us and our ability to protect and enforce our intellectual property rights;

our ability to manage our business and conduct our operations internationally;

our exposure to foreign currency exchange rate fluctuations;

our use of “open source” software could subject our technology to general release, require us to re-engineer our platform or subject us to litigation;

seasonal fluctuations in advertising activity;

our limited operating history, which makes it difficult to evaluate our business and prospects;

adverse developments in the tax laws and regulations, or disagreements with our tax positions, in the multiple jurisdictions in which we are subject to taxation;

our estimates of market opportunity and forecasts of market growth may prove to be inaccurate;

impairment of goodwill or other intangible and long-lived assets;

restrictions contained in the New Revolving Credit Facility (as defined herein);

our potential need for future additional financing that may not be available or may reduce our profitability;

future sales of shares by us or our existing stockholders;

3

Table of Contents

lack of research or misleading or unfavorable research published about our business by securities or industry analysts;

the significant influence over us by funds affiliated with Providence Equity Partners L.L.C. (“Providence”);

future offerings of debt or equity securities that would rank senior to our common stock;

our ability to maintain an effective system of internal controls;

our ability to fulfill our obligations incident to being a public company, including compliance with the Exchange Act and the requirements of the NYSE, the Sarbanes-Oxley Act and the Dodd-Frank Wall Street Reform and Consumer Protection Act (the “Dodd-Frank Act”); and

the possibility of being subject to securities class action litigation due to future stock price volatility.

You should read this Annual Report on Form 10-K completely and with the understanding that actual future results may be materially different from expectations. All forward-looking statements made in this Annual Report on Form 10-K are qualified by these cautionary statements. These forward-looking statements are made only as of the date of this Annual Report on Form 10-K, and we do not undertake any obligation, other than as may be required by law, to update or revise any forward-looking or cautionary statements to reflect changes in assumptions, the occurrence of events, unanticipated or otherwise, and changes in future operating results over time or otherwise.

MARKET AND INDUSTRY DATA

This Annual Report on Form 10-K includes industry and market data and forecasts pertaining to the industry and markets of DoubleVerify Holdings, Inc. (“DoubleVerify”), including market sizes, market share, market positions and other industry data. Such information is based on our analysis of multiple sources, including publicly available information, industry publications and surveys, reports from government agencies, reports by market research firms and consultants and our own estimates based on internal company data and our management’s knowledge of and experience in the market sectors in which we compete (together, the “Company Data Analysis”). The third-party information contained within the Company Data Analysis has primarily been derived or extrapolated from reports prepared or published by Ad Age, Magna Global and The Harris Poll. We have not independently verified the market and industry data from third-party sources and thus the accuracy and completeness of such information cannot be guaranteed. This information cannot always be verified with complete certainty due to the limits on the availability and reliability of raw data, the voluntary nature of the data gathering process, and other limitations and uncertainties inherent in surveys of market size.

SERVICE MARKS, TRADEMARKS AND TRADE NAMES

We hold various service marks, trademarks and trade names, such as DoubleVerify, our logo design, DV Authentic Ad, DV Authentic Attention, DV Pinnacle, Authentic Brand Safety and Authentic Brand Suitability, that we deem particularly important to the marketing activities conducted by each of our businesses. Solely for convenience, the trademarks, service marks and trade names referred to in this Annual Report on Form 10-K are without the ® and ™ symbols, but such references are not intended to indicate, in any way, that we will not assert, to the fullest extent under applicable law, our rights to these trademarks, service marks and trade names. This Annual Report on Form 10-K also contains trademarks, service marks and trade names of other companies which are the property of their respective holders. We do not intend our use or display of such names or marks to imply relationships with, or endorsements of us by, any other company.

4

Table of Contents

Unless the context otherwise requires, the terms “DoubleVerify,” ‘‘we,’’ ‘‘us,’’ ‘‘our,’’ and the ‘‘Company,’’ as used in this report refer to DoubleVerify and its consolidated subsidiaries. DoubleVerify and its subsidiary DoubleVerify MidCo, Inc. changed their names from Pixel Group Holdings Inc. and Pixel Parent Inc., respectively, prior to the date of this Annual Report on Form 10-K. All references to DoubleVerify and DoubleVerify MidCo, Inc. are to these entities both prior to and after the name changes.

5

Table of Contents

PART I

Item 1. Business

Our Company

We are a leading software platform for digital media measurement and analytics. Our mission is to create stronger, safer, more secure digital transactions that drive optimal outcomes for global advertisers. Through our software platform and the metrics it provides, we help preserve the fair value exchange between buyers and sellers of digital media.

The advertising industry continues to shift from traditional mediums to an expanding array of digital channels and platforms. Digital advertisers have historically relied on inconsistent, self-reported data from a large number of publishers, social channels and programmatic platforms, making it difficult to form an accurate, unbiased view of how and where their ad budgets are spent. As objectionable content and ad fraud have proliferated across the Internet and other digital channels, advertisers are utilizing independent, third-party solutions to protect their brand equity and optimize the performance of their digital media investments.

Our technology addresses this need by providing unbiased data analytics that enable advertisers to increase the effectiveness, quality and return on their digital advertising investments. Our proprietary DV Authentic Ad metric is our definitive metric of digital media quality, which measures whether a digital ad is displayed in a fraud-free, brand-suitable environment and is fully viewable in the intended geography. Our software platform delivers this metric to our customers in real time, allowing them to access critical performance data on their digital ads. Customers then leverage our data analytics to improve the efficiency of their digital advertising investments by avoiding wasted media spend on blocked or fraudulent ads and to optimize their media strategies in real time by verifying their highest performing ads and content.

Our software platform is integrated across the entire digital advertising ecosystem, including programmatic platforms, social media channels and digital publishers. We deliver unique data analytics through our customer interface, DV Pinnacle, to provide detailed insights into our customers’ media performance on both direct and programmatic media buying platforms and across all key digital media channels (including social, video, mobile in-app and connected TV (“CTV”)), formats (including display and video) and devices (including mobile, desktop and connected televisions). Our technology enables programmatic media traders to evaluate approximately 300 billion transactions daily, ensuring that a digital ad meets the advertiser-defined quality criteria before it is purchased. We also analyze more than 11 billion digital ad transactions daily, measuring whether ads are delivered in a fraud-free, brand-suitable environment and are fully viewable in the intended geography. Our software platform and unique position in the advertising ecosystem allows us to develop a significant data asset that accumulates over time as we measure an increasing number of media transactions. We are able to leverage our data asset across our existing solutions as well as expand the data asset to launch new solutions that address the evolving needs of advertisers.

Our blue-chip customer base includes many of the largest global brands. We serve over 1,000 customers that are diversified across all major industry verticals, including consumer packaged goods, financial services, telecommunications, technology, automotive and healthcare. In 2022, we had 78 customers who each represented at least $1 million of annual revenue, up from 64 such customers in 2021 and 45 and 41 such customers in 2020 and 2019, respectively, with no customer representing more than 10% of our revenue in 2022, 2021 or 2020. In addition to locations in which we currently have a remote or contracted workforce, we serve our customers globally through our offices or commercial operations in 21 locations across 17 countries, including the United States, the United Kingdom, Israel, Singapore, Australia, Brazil, Germany and the United Arab Emirates.

6

Table of Contents

We generate revenue from our advertising customers based on the volume of media transactions, or ads, that our software platform measures (“Media Transactions Measured”), for which we receive an analysis fee (“Measured Transaction Fee”), enabling us to grow as our customers increase their digital ad spend and as we integrate into new channels and platforms. We have long-term relationships with many of our customers, with an average relationship of over seven years for our top 75 customers and over eight years for both our top 50 and 25 customers, and ongoing contractual agreements with a substantial portion of our customer base. We have maintained exceptional customer retention with gross revenue retention rates of over 95%, and 100% retention of our top 75 customers, in each of 2022, 2021 and 2020. We are also able to increase revenue per customer as we introduce new solutions, which has resulted in a compounded annual growth rate in average revenue for our top 100 customers of 35% from 2019 to 2022.The combination of high customer retention and multiple upsell opportunities has resulted in net revenue retention rates of 127% in 2022, 126% in 2021 and 123% in 2020. With respect to our overall business, we have delivered strong historical revenue growth, with a compounded annual growth rate of 35% from 2019 to 2022.

Our History

Our company was founded in 2008 and introduced our first brand safety and suitability solution in 2010. As the global digital advertising market has evolved, we have continued to expand our capabilities through new product innovation and partnerships across emerging programmatic media buying platforms and digital media channels, including social and CTV. Several key milestones since our company was founded include:

2008: Founded in Israel
2010: Launched first brand safety and suitability solution; Opened company headquarters in New York and established presence in London
2011: Launched first pre-bid targeting solution
2012: Launched first viewability solution
2013: Received first accreditation from the MRC
2014: Launched first fraud solution
2015: Integrated with programmatic partners, including The Trade Desk and Google
2017: Announced social platform partnerships with Facebook, Snap and YouTube; Providence acquired a majority equity interest in our company
2018: Launched partnership with Twitter; Opened international offices in EMEA (Germany, France), APAC (Singapore, Australia) and Brazil; Acquired Leiki Oy (“Leiki”)
2019: Launched Authentic Brand Suitability; Acquired Zentrick NV (“Zentrick”) and Ad-Juster Inc. (“Ad-Juster”)
2020: Expanded presence in APAC region (Japan, India); Launched partnership with Pinterest; Introduced CTV certification program; Developed and introduced new products, including DV Authentic Attention, DV Publisher Suite and our Custom Contextual solution; First third-party solution to gain MRC accreditation for integrated viewability measurement on Facebook
2021: Received MRC accreditations for display and video rendered ad impression measurement and sophisticated invalid traffic (SIVT) filtration, including app fraud, in the CTV media environment, and for video filtering, benchmarks, and CTV fully on-screen metrics; Completed our initial public offering of our common stock (“IPO”); Launched partnership with TikTok; Acquired Outrigger Media, Inc. (d/b/a “OpenSlate”) and Meetrics GmbH (“Meetrics”)
2022: Released Fully On-Screen pre-bid targeting and the DV Authentic Attention Snapshot; Received MRC accreditations for DV’s independent third-party calculation and reporting of

7

Table of Contents

Google’s Ads Data Hub (ADH) Video Impressions, viewable impressions and related viewability metrics, Display and Video DV Authentic Attention, and Display and Video CTV Ad verification metrics in English as well as eight other languages; Announced partnerships with Reddit, Scope3, Twitch, LinkedIn and Netflix; Launched post-campaign Brand Safety and Suitability measurement on TikTok; Received ISO 27001:2013 certification for our information security management system

Our Industry

We believe that our business benefits from many of the most significant trends in digital marketing and advertising, including:

Significant Growth in Digital Ad Spend. The global advertising industry continues to shift from traditional forms of media to digital channels and platforms. Magna Global estimated that global digital ad spend, excluding search, reached over $253 billion in 2022 and is expected to grow to $352 billion by 2027. We believe the shift towards digital spend will continue as new distribution channels and advertising formats emerge that enable advertisers to more effectively reach their target audiences.

Acceleration of Programmatic Ad Buying. Advertisers are increasingly shifting their digital media buying to programmatic platforms, which automate the digital ad buying process through the use of computer algorithms and deliver targeted advertisements utilizing vast data sets. Programmatic ad buyers and trading platforms benefit from consistent access to high quality and accurate data and analytics to improve purchasing decisions and optimize the efficacy of their ads. Furthermore, advertisers value having a single, unified data source for all of their digital media transactions that they can leverage to help make real-time decisions on programmatic ad placements across all channels and formats.

Emergence of CTV and Other New Digital Channels. Over time, the emergence of new digital channels, such as social, has attracted significant advertiser interest and investment. In turn, this has created additional demand for digital measurement and analytics solutions. Today, CTV represents a large new frontier for digital advertising as global linear television media spend continues to migrate to digital channels. CTV presents a significant opportunity for full-suite measurement and analytics providers due to the fragmented inventory and ad fraud emerging within this channel.

Importance of Brand Reputation. With the increasing scale of digital media channels, advertisers are placing a greater emphasis on understanding where their ads are placed and the content with which it is presented. Context of ad placement has become as important to a brand as the content of the ad itself. Determining the context and content of a web page, streaming video or social post is more complex than verifying a keyword or article headline and often varies minute-by-minute. This challenge is further complicated by a significant increase in user-generated content, as ad spend on social platforms continues to expand. According to a study that we commissioned with The Harris Poll, nearly two-thirds of consumers expressed that they would stop using a brand or product that advertises next to false, objectionable or inflammatory content. More than ever, advertisers are being held accountable for brand and content alignment. In response, advertisers are adopting scalable, sophisticated brand suitability solutions to ensure effective use of their global digital media spend.

Desire to Improve Media Quality and Effectiveness. The significant growth in digital advertising has resulted in wasted ad spend due to ads that are never seen as a result of continually evolving ad fraud activities, including bots, fake clicks and fraudulent web sites. New and sophisticated schemes, particularly across emerging channels such as CTV and mobile in-app, are uncovered each day. We have identified over 19,000 fraudulent CTV/mobile apps as of December 31, 2022. In addition, even when an ad is verified to be fraud- free, there is no certainty that it is actually viewable. To combat these issues, advertisers, digital publishers and media platforms rely on robust measurement solutions to validate the performance of their marketing campaigns and ensure that they are only paying for verified ads.

8

Table of Contents

Rising Adoption of Independent, Cookie-Less, Cross-Platform Solutions. The proliferation of digital channels, formats and devices has made it more difficult for advertisers to measure campaign performance across all platforms. This measurement has been further complicated by recent moves by some large device manufacturers and certain closed platforms, which are often referred to as “walled gardens,” to restrict cookie and identifier-based data sharing. As a result, advertisers are increasingly adopting full-suite solutions that are not dependent on cookies or cross-site individual-level data trackers and can be used seamlessly across devices, the open web and the walled gardens. Point solutions that only deliver single metrics, often on a limited amount of media, and which are based on challenged data aggregation methods, continue to lose traction with advertisers. This has created a growing demand for independent, third-party providers that provide accredited and unified data analytics that improve the transparency and effectiveness of digital ad spend across the entire ecosystem without relying on cookies.

Our Strengths

We believe the following attributes and capabilities form our core strengths and provide us with competitive advantages:

Best-in-Class Software Platform. Our technology stack enables us to develop proprietary advertising performance metrics on each digital ad transaction. This precision sets us apart from our competitors and allows us to combine and deliver performance measurements across fraud, brand safety and suitability, viewability and geography into a single, unique metric (the DV Authentic Ad), as well as the flexibility to disaggregate and analyze the individual measurements for each delivered ad. We believe we are able to provide the most robust data analytics in the industry, analyzing hundreds of data points for each delivered ad and across billions of ads every day, with approximately 5.5 trillion Media Transactions Measured by us in 2022.

Broad Ecosystem Coverage. We provide comprehensive performance measurement metrics across all key digital channels where our customers advertise and deliver them through the major platforms through which they purchase advertising. Our technology is used in major platforms that provide direct, programmatic and social advertising, including Google, Facebook, TikTok, Amazon and The Trade Desk. As new media formats emerge, the strength of our solutions and the flexibility of our software platform allows us to seamlessly onboard new integration partners and secure new partnerships as selling channels for our solutions. For example, as CTV continues to become an increasingly prominent advertising channel, we have secured partnership agreements with multiple leading CTV platforms, including Netflix, Amazon and Roku, that have certified our measurement solutions for use on their platforms. We believe that we provide the broadest integration and partnership coverage across the industry.

Powerful Network Effect Fueled by a Robust and Scalable Data Asset. Our software platform and unique position in the advertising ecosystem allows us to develop a significant data asset that accumulates over time as we measure an increasing number of media transactions. This virtuous cycle allows us to deliver better results as we build broader data sets and enables us to enhance and expand the solutions we deliver to customers. We collected and analyzed data points on the approximately 5.5 trillion Media Transactions Measured by us in 2022, up from 4.5 trillion Media Transactions Measured in 2021 and 3.2 trillion in 2020. The knowledge from the billions of detailed data points we gather daily has enabled us to develop an extensive data asset that we leverage across our existing solutions as well as expand the data asset to launch new solutions that address the evolving needs of advertisers. The strength of our solutions attracts new customers which increases the ad transactions we measure and data we collect, further strengthening the value of our network.

Compelling Value Proposition Driving High Customer ROI. We enable our customers to optimize return on their marketing investments for a fraction of the underlying media cost. Our unique data analytics are used by our advertiser customers to target the highest performing ad inventory and receive refunds or credits for digital ads that do not meet certain criteria. In addition, our solutions help our customers preserve one of their most important and invaluable assets — brand reputation — by ensuring ads are not shown near content that is inconsistent with their brand message.

9

Table of Contents

Track Record of Successful Product Innovation. We have a track record of developing new solutions for our customers that provide increased relationship value and drive incremental average revenue per customer, thereby deepening our competitive edge. As of December 31, 2022, we had 169 software and data engineers employed with us throughout our six research and development centers focused on product development, including our office in Tel Aviv. We launched our first brand safety and suitability solution in 2010 and have continued to develop leading-edge solutions ever since. We have continued our track record of innovation in recent years as demonstrated by the launch of Authentic Brand Suitability, which we believe is the industry’s first solution that allows advertisers to programmatically avoid unsuitable content across platforms using the same settings established for post-bid evaluation. In 2019, we launched our first CTV solutions which now detect over 1,200,000 fraudulent device signatures per day, providing significant savings to our clients by preventing wasted ad spend. In 2020, we developed DV Authentic Attention, which we believe is the first solution in the market to combine dozens of ad exposure and user engagement metrics on individual impressions to provide predictive analytics and improve performance outcomes, and introduced our Custom Contextual solution, which allows advertisers to match their ads to relevant content without depending on cookie-based or cross-site tracking.

Loyal and Growing Customer Base. Our customers currently include over 50 of the top 100 global advertisers, according to Ad Age, including Comcast, Best Buy, Mondelēz and Pfizer. In each of the years 2020-2022, we maintained over 95% gross revenue retention rates across our customer base and retained 100% of our top 75 customers. With this foundation, we were able to drive net revenue retention of 127% in 2022, 126% in 2021 and 123% in 2020 through increased advertising volume and the successful launch of newly-introduced solutions. This growth in our existing customer base together with strong new customer wins has increased the number of customers contributing over $1 million of revenue to 78 customers in 2022, up from 64 customers in 2021 and 45 customers in 2020.

Scaled and Profitable Business Model. We have an attractive operating model, driven by the scalability of our platform, the consistent nature of our revenue, our significant operating leverage and low capital intensity. Our platform allows us to provide large-scale data analytics to customers around the world seamlessly and cost-effectively. We are able to scale our solutions efficiently and with limited incremental cost for new customers and additional solutions. We have grown our business rapidly while also achieving profitability, demonstrating the strength of our platform and business model. For additional detail on costs of sales excluding depreciation and amortization, see “Management’s Discussion and Analysis of Financial Condition and Results of Operations — Results of Operations.”

Well-Aligned with Privacy Restrictions and Platform Evolution. We believe that we are well-positioned to benefit from broader government regulations and changing industry privacy standards that increasingly restrict the collection and use of personal data for advertising purposes. Additionally, as device manufacturers and walled garden platforms aggressively move to curtail the use of cookie-based data collection across their properties, measurement, targeting and advertising analytics solutions that are not based on these tracking and collection tools will benefit. Our core software platform does not rely on third-party cookies, persistent identifiers or cross-site tracking technology to deliver our measurement and analytics solutions. Additionally, the core contextual data set that we use to provide our measurement and analytics solutions can also provide advertisers with an alternative source of data to deliver targeted advertising. To capitalize on this rapidly evolving environment and to leverage a system that is not reliant on cookie-based or personalized data collection, we introduced our Custom Contextual solution in late 2020, which allows advertisers to match their ads to relevant content to maximize user engagement and drive campaign performance, without depending on cookie-based or cross-site tracking. In February 2021, we released DV Authentic Attention, a performance measurement solution that leverages pseudonymous, privacy-friendly data to analyze advertising engagement, as an alternative to individual reach and frequency performance tools. As privacy restrictions evolve and tracking identifiers such as cookies become increasingly restricted by walled gardens, we believe there will be increased demand for our contextual targeting and performance solutions.

Proven Management Team. We have a strong management team that has extensive experience leading software and digital marketing companies. We believe that our management team will continue to drive our growth, scale and solutions innovation.

10

Table of Contents

Our Growth Strategy

We intend to continue penetrating the digital advertising market through the following key growth levers:

Growing with Our Current Customers. We expect to continue to grow with our existing customers as they increase their spend on digital advertising and as we introduce new solutions. We expect the increased demand for third-party digital advertising data analytics to fuel continued adoption of our solutions across key channels, formats, devices, geographies and buying platforms. For example, we anticipate solutions like Authentic Brand Suitability, DV Authentic Attention and Custom Contextual, as well as the convergence of linear and addressable television, to continue to drive growth from our existing customers. Moreover, as content consumption shifts to platforms like Facebook, YouTube, TikTok and others, we expect advertisers will be keen to adapt their online presence – as well as their quality and performance measurement solutions – to these new and growing areas. These are trends we are poised to take advantage of as a result of our acquisition of OpenSlate.

Expanding Our Customer Base. We intend to continue targeting new advertiser, programmatic platform and digital publisher customers who have not yet adopted digital ad measurement and analytics solutions, as well as those currently utilizing solutions provided by our competitors or point solutions.

Expanding Our International Presence. We intend to continue to grow our presence in international markets in order to meet the needs of our existing customers and accelerate new customer acquisition in key geographies outside of North America. We have offices or commercial operations in 21 locations across 17 countries, and our international expansion has accelerated our revenue growth in those markets. As of December 31, 2022, we have 348 employees based outside of the Americas, including 108 employees in our Tel Aviv office and 70 employees in our London office.

Introducing New Solutions and Channels. We will continue to be an industry leader in innovation by developing premium solutions that increase our value proposition to our existing customers. We have a strong track record of rolling out new solutions that have high adoption rates with our existing customers. We intend to extend our solutions capabilities to cover new and growing digital channels and devices, including CTV, new mobile apps and other emerging areas of digital ad spend.

Pursuing Opportunistic M&A. We maintain an active pipeline of potential mergers and acquisitions (“M&A”) targets and intend to continue evaluating add-on opportunities to bolster our current solutions suite and complement our organic growth initiatives. We believe that the availability of borrowings under our New Revolving Credit Facility together with cash on hand make us well-positioned to capitalize on potential M&A opportunities.

What We Do

We are a leading software platform for digital media measurement and analytics. Our leadership in our industry is based on our differentiated technical capabilities resulting from years of innovation, our breadth of industry accredited solutions and an expansive network of integration partners that enable us to analyze media transactions across the global digital ecosystem. Our solutions empower our customers to address the evolving and intensifying complexities of driving optimal outcomes for their digital transactions. We deliver our suite of solutions through a robust and scalable software platform that provides our customers with unified data analytics. Our broad market coverage of the digital advertising ecosystem and our leading software platform enables us to analyze billions of data points globally each day. We collected and analyzed data points on the approximately 5.5 trillion Media Transactions Measured by us in 2022, up from 4.5 trillion Media Transactions Measured in 2021 and 3.2 trillion in 2020. This volume has enabled us to build a self-reinforcing, proprietary data asset which we redeploy in new solutions that further enhance and expand the analytics that we can deliver to our customers and partners.

11

Table of Contents

Our Solutions

The DV Authentic Ad

The DV Authentic Ad is our definitive metric of digital media quality, which evaluates the existence of fraud, brand safety and suitability, viewability and geography for each digital ad:

Fraud: Our solutions are designed to safeguard advertisers against increasingly sophisticated invalid digital traffic, such as bot fraud, site fraud, malware (including adware), and app fraud. We continuously monitor and analyze billions of delivered digital ads on a daily basis for aberrant activity in order to detect new fraud schemes. Each day, we identify over 10 million active fraudulent device signatures, distributing them to our partners nearly 100 times per day, thereby enhancing the protection we provide our customers.
Brand Safety and Suitability: Our customers use the data analytics that our software platform provides to target desired contexts and help prevent their ads from appearing next to content that they do not deem appropriate for their brands. Our brand safety and suitability solutions evaluate the full context of a webpage including the URL and the specific content. Our approach combines rich content ontology and proprietary artificial intelligence tools with human expertise to appropriately categorize content across over 40 languages. We offer brands the ability to dynamically configure 73 avoidance categories, nearly half of which contain a risk tier aligned with the recently released industry- defined standards, such as disasters, inflammatory news and politics, and hate speech or profanity, allowing brand messages to be delivered in a curated and suitable environment. Customers can use our extensive content categories to target desired contexts for their ads, without relying on third-party cookies, persistent identifiers or cross-site tracking technology. We also offer Authentic Brand Suitability, which is an enhanced set of contextual targeting solutions that can be deployed across multiple programmatic platforms.
Viewability: Digital ads are frequently obscured, paused before fully delivered or placed in locations that are out of view from the intended recipient. We help our customers determine if their ads are in-view by the recipient of each advertisement by providing advanced viewability metrics, including average time-in-view, key message exposure and video player size. Our solutions also leverage our historical data to predict the viewability of ads to optimize programmatic buying decisions.
Geography: Many of our customers run distinct media campaigns that are targeted toward distinct geographic regions. The intended geography of these media campaigns may be specified due to the content or offer of the digital ad, the language in which it is presented or for regulatory and compliance reasons. Our customers leverage our solutions to ensure that their geographic targeting requirements are met and that there is language alignment between the digital ad and the intended geographic region.

DV Authentic Attention

DV Authentic Attention is DoubleVerify’s MRC-accredited, privacy-friendly attention measurement solution that provides actionable, comprehensive data to drive campaign performance — from the impact of an ad’s presentation to key dimensions of consumer engagement. Developed in 2020 and released in February 2021, this rich dataset enables granular attention measurement and campaign optimization at scale.

12

Table of Contents

Building on the data we aggregate to deliver our definitive media quality metric, the DV Authentic Ad, DV Authentic Attention analyzes data points on the exposure of a digital ad and consumer’s engagement with a digital ad and device — in real-time. For exposure, DV Authentic Attention evaluates an ad’s entire presentation, quantifying its intensity and prominence through metrics that include viewable time, share of screen, video presentation, audibility, and more. For engagement, DV Authentic Attention analyzes key user-initiated events that occur while the ad creative is exposed, including user touches, screen orientation, video playback, and audio control interactions. Exposure and Engagement ladder up into the DV Attention Index, an overarching measure of attention that provides key insights into campaign performance. Our customers use DV Authentic Attention to predict which ads will impact consumers and drive outcomes, enabling them to make changes to their media strategies in real time.

Custom Contextual

In late 2020, we launched our Custom Contextual solution to enhance our programmatic advertising solutions. Advertisers use our Custom Contextual solution to match their ads to relevant content in order to maximize user engagement and drive optimal campaign performance. Custom Contextual metrics leverage our content-derived analytics data and are not reliant on third-party cookies or cross-site tracking technology. Custom Contextual enables advertisers to target audiences based on key points of interest even in web browsers and operating systems that have phased out or ended the use of third-party tracking technology, and also positions them to align with existing privacy regulations.

Supply-Side Solutions

We provide our software solutions and data analytics to publishers and other supply-side customers to enable them to maximize revenue from their digital advertising inventory. Supply-side advertising platforms (such as ad networks and exchanges) utilize our data analytics to validate the quality of their ad inventory and provide metrics to their customers to facilitate the targeting and purchasing of digital ads. We also provide the DV Publisher Suite, a unified solution for digital publishers to manage revenue and increase inventory yield by improving video delivery, identifying lost or unfilled sales, and better aggregate data across all inventory sources. The DV Publisher Suite provides the following features to publishers:

Unified Analytics: Eliminates manual, cumbersome, and repetitive tasks with automatically pulled reports to quickly aggregate and normalize a publisher’s data and improve decision-making, ROI and operational efficiency.
Campaign Delivery Insights: Tools gather, normalize and analyze campaign delivery to effectively drive yield on digital direct-sold inventory.
Media Quality Insights & Optimization: Powering publishers with analytics and data targeting on deliverability, suitability, viewability and existence of fraud to gain insights into performance and automatically implement ad selection targeting to improve yield.
Industry Benchmarks: Providing insight to publishers on the performance of their inventory in key metrics compared with competing publishers.
Video Delivery Automation: Improves the user experience and maximizes video revenue from a publisher’s video inventory through automated healing and acceleration technology.

How We Deploy Our Solutions

We provide a consistent, cross-platform measurement standard across all major forms of digital media, making it easier for advertiser and supply-side customers to benchmark performance across all of their digital ads and to optimize their digital strategies in real time. Our coverage spans nearly 100 countries where our customers activate our services and covers all key digital media channels, formats and devices.

13

Table of Contents

We also maintain an expansive set of direct integrations across the entire digital advertising ecosystem in order to deliver our metrics to the platforms where our customers buy ads. Our partner integrations include leading programmatic platforms, such as The Trade Desk, Google Display & Video 360, Amazon, Yahoo and Xandr. Through these integrations, our customers utilize our solutions to better evaluate and optimize inventory purchase decisions. We also have direct integrations and partnerships with key social platforms, including Facebook, YouTube, TikTok, Twitter, Pinterest and Snap, as well as leading CTV platforms, including Amazon and Roku, which allow us to deliver more robust social campaign and CTV data analytics to our advertiser customers. Together, we work seamlessly to empower our partners by providing advertisers clarity and confidence in their digital investments across all key platforms.

Our Customer Interface

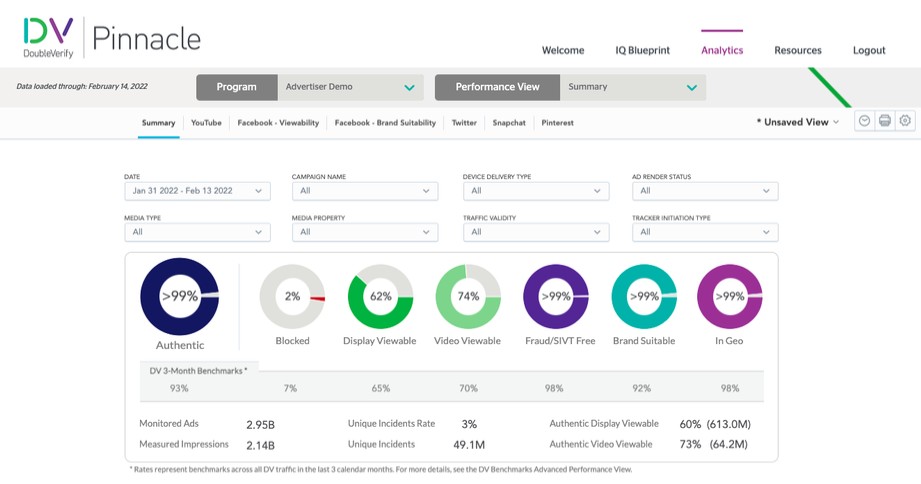
We believe our proprietary customer interface, DV Pinnacle, was the industry’s first unified service and analytics platform user interface. DV Pinnacle allows our customers to adjust and deploy controls for their media plan and track campaign performance metrics across channels, formats and devices.

Profile and Controls: DV Pinnacle allows brands to set profiles and adjust controls for their media plan’s verification settings which are then consistently and automatically deployed across all of an advertiser’s digital buying channels. Our customers use DV Pinnacle to configure their Authentic Brand Suitability settings such as inclusion/exclusion lists, override lists, custom keyword avoidance, inappropriate content avoidance categories, as well as app brand suitability controls such as filtering by app category, star reviews and age ratings. These settings are then automatically uploaded into our customers’ programmatic platforms for complete synchronicity between their pre bid and post purchase and measurement settings.

Analytics: DV Pinnacle also provides over 780 analytics and reporting metrics and over 150 industry benchmark filters in an easy-to-use dashboard, in order to track campaign performance metrics across channels, formats and devices. This enables advertisers to gain a clear understanding of the quality and effectiveness of their digital media campaigns and allows them to take appropriate actions for campaign optimization. DV Pinnacle generates industry benchmarks that are dynamically refreshed enabling customers to compare the quality of their ads against their peers and allows users to set specific thresholds on key performance indicators that drive success of the media campaign, such as blocking rates, ad delivery and viewability.

DV Pinnacle screenshot:

Graphic

14

Table of Contents

Integration and Channel Partnerships

Our technology is integrated with leading digital advertising technology channels, supporting the distribution of our programmatic solutions and enabling us to analyze a broad footprint of data and deliver a comprehensive analysis for our customers. These digital ecosystem integrations are highly complex, requiring significant time and capital to develop, and they are a key driver of our success by creating highly scalable network effects. Our position as a strong, independent analytics partner has enabled us to integrate with key global platforms, including social channels, many of whom are very selective in granting third parties access to their technology environments.

As new media formats emerge, the strength of our solutions and the flexibility of our software platform allows us to efficiently onboard new integration partners and secure new partnerships as selling channels for our solutions. For example, as CTV continues to become an increasingly prominent advertising channel, we have secured partnership agreements with multiple leading CTV platforms, including Amazon and Roku, which have certified our measurement solutions for use on their platforms. We believe that we provide the broadest integration and partnership coverage across the industry. Further, as we build new product sets, these flexible integrations and partnerships allow for seamless distribution of new services on existing partner platforms. We maintain a team of dedicated business development professionals who manage existing partnerships and develop new channels.

Select integration and channel partners include:

Demand-Side Platforms: Amazon, Google, The Trade Desk, Yahoo, Amobee, AppNexus, MediaMath, Adobe, Xandr
Ad Platforms and Exchanges: Yahoo! Japan, Magnite, Teads, Epsilon, Tremor, LG Ads
Ad Servers and Ratings/Workflow Platforms: Nielsen, Google and MediaOcean Prisma
Social Platforms: Facebook, Instagram, YouTube, Twitter, Snapchat, Pinterest, TikTok
CTV: Amazon, Netflix, and Roku

Our advertising customers often purchase the Company’s solutions through a Demand-Side Platform. Demand-Side Platforms have technology to manage an advertiser’s bidding process on exchanges that facilitate the buying and selling of advertising inventory from multiple advertising networks. Customers leverage the Company’s solutions on Demand-Side Platforms to enable the advertiser to evaluate the quality of advertising inventory up for bid on an advertising exchange. To make the Company’s solutions available to advertiser customers through a Demand-Side Platform, the Company enters into agreements with programmatic partners that allow our technology to be integrated into the Demand-Side Platform and enable customers to access our solutions through the platform. Under the terms of these agreements with Demand-Side Platforms, the programmatic partner collects fees from the Company’s advertiser customers and remits them to the Company. Because our advertiser customers obtain control of the Company’s solutions to inform their purchasing decision, rather than the programmatic partners providing access to the Demand-Side Platform, the Company records revenue for the gross amounts paid by its advertiser customers for these Company-provided solutions, and the amounts retained by the programmatic partners are recorded by the Company as a cost of sales.

Sales, Marketing and Customer Support

Our go-to-market strategy for new customers is focused on driving awareness for our solutions, and fostering relationships with senior brand executives and Chief Marketing Officers of leading brands, agencies and publishers. Our sales presentation is focused on the market challenges that we address, the benefits that customers have achieved utilizing our solutions and the product innovation and differentiation that drive our superior results. We target the largest global advertisers and we believe that we offer the most comprehensive suite of solutions available in the market.

15

Table of Contents

Our commercial organization is aligned by geographically focused teams, comprising sales and account management professionals in the Americas, EMEA and APAC, and professionals dedicated to global client and agency relationships. We regularly seek to expand into new geographies based on demand from existing customers and the attractiveness of the potential market opportunity, including recent expansion in Japan, India and the Middle East region.

Our sales professionals are responsible for driving the overall commercial strategy, establishing early connections and maintaining relationships with large, blue-chip brands and global advertising agencies and expanding our existing customer relationships. Our customer support team handles all aspects of customer relationships from pre-sale technical support to client onboarding, training and implementation of our services. Account managers work closely with product managers to provide direct customer feedback, which is also shared with our technology and development organization, enabling them to implement ongoing improvements and identify potential new product categories.

Our marketing team’s objectives are to build brand leadership globally, drive sales empowerment through lead generation and top-of-funnel pipeline growth, and support customer retention and up-sell through industry insights, thought leadership and analysis of customer data. We execute this strategy through frequent publications of industry insight reports, whitepapers, case studies, earned media, participation at industry conferences and frequent engagement with the world’s leading brands.

As of December 31, 2022, we had 408 professionals on our Commercial organization teams, of which 159 were sales professionals, 47 were marketing professionals and 202 were account managers and customer support representatives. Our sales, marketing and customer support expenses were $107.4 million, $77.3 million and $62.2 million for each of the years ended December 31, 2022, December 31, 2021 and December 31, 2020.

Product Development

Ongoing product innovation is central to our business. Rapid advancement of our product capabilities has enabled our business to meet customer needs in the dynamic digital advertising landscape. Through our innovation, we have been able to seamlessly add new capabilities to our solutions over time.

Our engineering team, consisting of 245 employees as of December 31, 2022, is responsible for the development of software and the operations of our infrastructure. As of December 31, 2022, we had 169 software and data engineers globally and six research and development centers focused on product development, including our office located in Tel Aviv. We use an agile development process with automated quality assurance, deployment and post-deployment testing to rapidly build, test and deploy new functionality.

Our product team, consisting of 145 employees as of December 31, 2022, is responsible for working with our sales, account management, marketing and business development teams to understand customer input, assess the market opportunity and define the product roadmap. This team is structurally aligned with our engineering organization to ensure there is direct accountability for all aspects of research and product development. Our team includes expert linguists, content classification analysts, fraud researchers and other supporting operational roles which provide the domain expertise and ongoing product development to ensure the highest possible quality of our technology.

Our product development expenses were $95.1 million, $62.7 million and $47.0 million for each of the years ended December 31, 2022, December 31, 2021 and December 31, 2020. We intend to continue to invest in our research and development capabilities to extend our platform to cover a broader range of products, customers and geographies.

Technology

Our technology is designed to provide our customers with precise, real-time decision-making and measurement data across their digital advertising campaigns. Our proprietary technology analyzes more than 11 billion digital ad transactions each day, measuring whether ads are delivered in a fraud-free, brand-suitable environment and are fully viewable in the intended geography. We own or perpetually license all aspects of our core software which we have built to be flexibly implemented on a variety of environments, allowing us to minimize cost while delivering the latency, growth and privacy needs of our global customers.

16

Table of Contents

Our commitment to providing innovative and accurate advertising data and analytics is accomplished through the following core technology components:

Configurable Settings: We have built a flexible configuration profile and settings distribution solution that allows customers to apply our software to their unique needs and brand preferences. Our flexible technology ensures that new campaigns and configurations are distributed across our global infrastructure in minutes.
Omni-Channel Display and Video Measurement Tags: We have built video and display measurement tags that seamlessly operate in any format or device, enabling simple tagging processes that minimize customer trafficking needs.
Advanced Owned & Operated Semantic Science Technology: Our owned and operated semantic science technology provides accurate and granular content classifications using machine learning and an ontology of over 180,000 distinct content topics.
Deterministic, Cross-Channel Fraud and Invalid Traffic Identification: We operate multiple proprietary fraud and invalid traffic detection models that benefit from the scale of the ads we analyze on a daily basis. Our fraud lab includes a dedicated team of data scientists, mathematicians and analysts from the cyber-fraud prevention community and we leverage AI, machine learning and manual review to detect new forms of fraud. Fraud signature updates are distributed into our serving infrastructure and to our partners nearly one hundred times per day to ensure maximum real-time protection for our customers and the deterministic nature of our algorithms helps to systematically assess risk.
Deeply Embedded Technology: Our technology is deeply embedded into major platforms and partners that provide direct, programmatic and social advertising. These integrations represent years of collective development, joint integration and ongoing quality assurance work between us and our partners.
Unified Analytics: Our customized analytics provide unified insights and analytics to both the digital advertising buyer and seller on every measured ad. We operate customized analytics dashboards, configurable insights and data delivery engines and seamless data integrations that maximize the utility of the data produced by our software.
Privacy Framework: We have built a privacy framework that is directly integrated into our measurement technology. This framework allows us to modify our services in real-time based on the regulatory jurisdiction and data collection consent status of each individual measured ad. Additionally, our core software platform does not rely on third-party cookies, persistent identifiers or cross-site tracking technology when deploying our solutions, making them more compatible with the expanding global regulatory framework related to data privacy.
Dedicated Information Security: Our platform hosts a large quantity of our customer media campaign data. We maintain a comprehensive information security program designed to ensure the security and integrity of our systems and our customers’ data. Our security program includes network intrusion monitoring and detection sensors deployed throughout our infrastructure and we leverage multiple vendors and a dedicated staff to provide 24/7 monitoring of our network. In addition, we obtain third party security assessments and audits of our infrastructure and security.
Reliable, Scalable and Redundant Infrastructure: We operate a global proprietary and redundant infrastructure that is highly available, fault tolerant and capital efficient.

17

Table of Contents

Certifications and Accreditations

Digital advertising measurement is subject to numerous governing industry standards, guidelines and best practices. Supporting these standards are organizations that conduct audit-based accreditations and other certification processes for media measurement products and to renew accreditations on an annual basis. We have received accreditations and certifications from a wide range of industry bodies, including the Media Rating Council (MRC), Trustworthy Accountability Group and Joint Industry Committee for Digital Advertising Quality (JICDAQ), and are signatory to or participate in initiatives by industry bodies such as the German Association for the Digital Economy (BVDW) and Centre d’Étude des Supports de Publicité (CESP). In addition, as part of our ongoing commitment to privacy compliance and data governance, we are the only major digital ad verification provider to achieve certifications for EU-U.S. focused International Privacy Verification (IPV), Asia-Pacific Economic Cooperation (APEC) Cross Border Privacy Rules (CBPR), and Privacy Recognition for Processors (PRP) through TrustArc. In 2022, we also achieved ISO 27001:2013 certification for our information security management system.

The MRC is a U.S. based independent organization that updates and maintains the Minimum Standards for Media Rating Research (the “MRC Minimum Standards”), which set strict guidelines for the media measurement industry and are intended to ensure:

accurate, reliable, and ethical procedures for producing ratings and audience research;
transparent and verifiable methodologies and survey information; and
secure and thorough electronic data reporting systems.

We are accredited by the MRC for our impression measurement solutions, including fraud, brand safety and suitability, display viewability and video viewability, and our proprietary metric, the DV Authentic Ad. In late 2020, we were the first third-party solution to gain MRC accreditation for integrated viewability measurement on Facebook. In early 2021, we received MRC accreditation for display and video rendered ad impression measurement and sophisticated invalid traffic (SIVT) filtration, including app fraud, in the CTV media environment and, in July 2021, we received MRC accreditation for video filtering, benchmarks, and CTV fully on-screen metrics. In 2021, we were also accredited by the MRC for classification in over 35 languages at the page and domain levels and accredited across 173 languages for language targeting and keyword blocking. In 2022, we were accredited by the MRC for our independent third-party calculation and reporting of Google’s Ads Data Hub (ADH) Video Impressions, viewable impressions and related viewability metrics, Display and Video DV Authentic Attention, and Display and Video CTV Ad verification metrics in English as well as eight other languages.

To receive these MRC accreditations, an independent third-party conducts annual audits of our solutions to evaluate whether they meet the MRC Minimum Standards, which include a technical review of our measurement and data analytics services and an evaluation of how we operate within the technical environments of the digital advertising ecosystem.

The accreditations and certifications of our products gives advertisers confidence in the efficacy and reliability of our solutions. These accreditations and certifications also ensure that our partners and other participants in the digital advertising ecosystem that are impacted by our digital media measurement can trust that our solutions are consistent, fair and meet industry standards. We continue to invest in maintaining and growing our accreditations and certifications as they are a key element to ensuring our solutions are trusted by market participants around the globe. The expansive coverage of our certifications and accreditations across metrics, standards, devices and regions represents a significant expenditure of capital and years of auditing that can be difficult for new market entrants to obtain.

18

Table of Contents

Competition

We operate in a competitive end market with multiple different types of competitors. Our primary competition is other digital ad measurement providers, including Moat and Grapeshot, which are part of the Oracle Data Cloud, and Integral Ad Science. There are several companies that provide point solutions that address individual aspects of digital ad measurement, such as HUMAN (formerly known as White Ops) and Zefr, or geographically focused companies. Some of our ad platform partners also offer their own measurement solutions solely for ads placed through their ad buying tools.

We believe the principal competitive factors in our market include the following:

the ability to provide an independent, unified and consistent MRC-accredited measurement of digital ads across all formats and channels;
the ability to provide accurate and reliable data insights on the brand suitability, existence of fraud and viewability of each digital ad to ensure that it meets all of these criteria;
the ability to innovate and adapt product offerings to emerging digital media technologies and offer products that meet changing customer needs;
the ability to support large, global customers and develop and maintain complex integrations with key partners across the digital advertising ecosystem;
the ability to achieve and maintain industry accreditations; and
the ability to collect this data across all key platforms and provide independent analytics to our customers.

We believe we compete favorably on these factors and we will continue to provide valuable data and analytics to our customers.

Seasonality

We experience fluctuations in revenue that coincide with seasonal fluctuations in the digital ad spending of our customers. Advertisers typically allocate the largest portion of their media budgets to the fourth quarter of the calendar year in order to coincide with increased holiday purchasing. As a result, the fourth quarter of the year typically reflects our highest level of measurement activity while the first quarter reflects the lowest level of such activity. We expect our revenue to continue to fluctuate based on seasonal factors that affect the advertising industry as a whole. While our revenue is highly recurring, seasonal fluctuations in ad spend may impact quarter-over-quarter results. We believe that the year-over- year comparison of results more appropriately reflects the overall performance of the business.

Intellectual Property

The protection of our intellectual property is important to our success and our internally developed technology provides the foundation of our proprietary suite of products. We rely on intellectual property laws in the U.S. and abroad, as well as confidentiality procedures and contractual restrictions, to protect our intellectual property. We believe our products are difficult to replicate and we will continue to enhance our intellectual property portfolio as we develop new products and services for our customers.

19

Table of Contents

We have two registered U.S. patents, four international patents (two in Europe and two in Japan) and six pending patent applications, including three in the U.S. We also hold various service marks, trademarks and trade names, including DoubleVerify, our logo design, DV Authentic Ad, DV Authentic Attention, DV Pinnacle, Authentic Brand Safety and Authentic Brand Suitability, that we deem important to our business. We have over 15 registered U.S. trademarks and four pending U.S. trademark applications, and over 15 trademarks that we have registered in various jurisdictions abroad.

People and Culture

We help brands improve the effectiveness of their online advertising, giving them clarity and confidence in their digital investment. Confidence is built on trust. We work to build trust by ensuring our company’s mission, team, and actions are aligned with transparency and authenticity. Trust is foundational to both the lasting partnerships we have built with clients and with our employees as well.

Employee Metrics

Behind all of our innovations are talented people around the world who bring them to life. We believe that attracting, engaging, and retaining top talent is crucial to our continued success. We have 902 passionate, accountable, collaborative, employees who are “All In” on our mission to optimize advertising outcomes for global brands. 598 of our employees are based in New York, London, and Tel Aviv, and approximately 40% are located outside of the Americas. We also incorporate contracted resources when necessary or advisable to expand the reach of our full-time workforce.

Diversity and Inclusion

We are committed to fostering an equitable, intentionally inclusive culture, where differences are celebrated, marginalized voices are heard, and each employee is empowered by a sense of belonging. We take action to realize this commitment through building our capabilities, investing in our people to fuel ingenuity and innovation, creating workplace environments that foster partnership, community, psychological safety and belonging, and using data to quantify our progress and hold each other accountable.

Investing in our people

We believe inclusive benefits are a critical part of delivering an exceptional employee experience for our people. Therefore, we offer a competitive compensation and benefits program that supports our employees’ physical, mental, and financial health.

To support the development of our employees’ skills and abilities, we provide a wide range of learning and growth opportunities including leadership, personal development, and other technical training. In addition, we provide tuition reimbursement for educational programs our employees may wish to enroll in outside of the programming we provide.

We are dedicated to the health, safety, and wellness of our employees, as each is integral to our success as an organization. We provide our employees and their families with access to a variety of programs, including access to online mental health resources, wellness expense reimbursements, and paid time off for “wellness days”. We embrace a flexible hybrid work model, enabling our employees to split time between working from the office and working from home. The number of colleagues that are fully remote has increased and we continue to reimagine the future of work to support the needs of our people.

20

Table of Contents

Regulatory Matters

U.S. and international data security and privacy laws apply to our business. As a general matter, our core software platform does not rely on third-party cookies, persistent identifiers or cross-site technology, but our measurement of digital ads depends, in part, on the use of certain tracking technologies to measure a user’s views and interactions with digital ads. As such, we rely on limited personally identifiable information to enable some aspects of our services. Our ability, like those of other advertising technology companies in the verification space, to use such tracking technologies is governed by U.S. and foreign laws and regulations, which change from time to time. Additionally, many countries have data protection laws with different requirements than those in the U.S. and this may result in inconsistent requirements and differing interpretations across jurisdictions. Governments, privacy advocates and class action attorneys are increasingly scrutinizing companies for compliance with data privacy requirements and the sufficiency of existing frameworks. Among the most sensitive topics currently being debated is the issue of the transfer of personally identifiable information between countries (known as onward transfers), with a particular focus on transfers from the European Union (“EU”) to the United States. After the Court of Justice of the European Union’s invalidation of the Privacy Shield, a transfer framework established by the EU and the United States to facilitate onward transfers, the Standard Contractual Clauses, the transfer mechanism we rely upon, have come under scrutiny although they remain valid. Although in 2022, EU and U.S. officials announced an agreement on “Privacy Shield 2.0” had been reached, it has not yet been officially adopted by the European Union. The continued uncertainty around the feasibility of onward transfers from the EU to the United States has the potential to adversely affect our operations and business.

New laws restricting the collection, processing and use of personal data have been enacted in California (the CCPA and the CPRA) and other states in the U.S., Brazil (the LGPD) and Europe (GDPR), and more are being considered that may affect our ability to implement our business models effectively. Further, COPPA applies to websites and other online services that are directed to children under thirteen (13) years of age and imposes certain restrictions on the collection, use and disclosure of personal information from these websites and online services. Changes or expansions to these and other legislation or regulations that further restrict the collection, processing and use of personal data, as well as the consequential changes to voluntary frameworks relied upon within the industry, could result in changes to the digital advertising ecosystem and our channel partners’ business practices and may require us to alter the functionality of our measurement solutions. We continue to monitor changes in all applicable data security and privacy regulations and laws in order to maintain compliance with such regulations and laws.

Available Information

We file Annual Reports on Form 10-K, Quarterly Reports on Form 10-Q, Current Reports on Form 8-K, proxy statements, and related amendments and other information with the Securities and Exchange Commission (“SEC”). You may access and read our filings without charge through the SEC’s website at www.sec.gov or through our website at http://ir.doubleverify.com, as soon as reasonably practicable after such materials are filed with or furnished to the SEC pursuant to Section 13(a) or 15(d) of the Exchange Act. 

Website addresses referred to in this Annual Report on Form 10-K are not intended to function as hyperlinks, and the information contained on our website is not incorporated into, and does not form a part of this Annual Report on Form 10-K or any other report or documents we file with or furnish to the SEC. 

21

Table of Contents

Item 1A. Risk Factors

RISK FACTORS

Investing in our common stock involves a high degree of risk. You should consider and read carefully all of the risks and uncertainties described below, as well as other information contained in this Annual Report on Form 10-K, including the Management’s Discussion and Analysis of Financial Condition and Results of Operations and our consolidated financial statements and related notes appearing elsewhere in this Annual Report on Form 10-K, before making an investment in our common stock. The risks described below are not the only ones facing us. The occurrence of any of the following risks or additional risks and uncertainties not presently known to us could materially and adversely affect our business, financial condition, results of operations or cash flows. In any such case, the trading price of our common stock could decline, and you may lose all or part of your investment. This Annual Report on Form 10-K also contains forward-looking statements and estimates that involve risks and uncertainties. Our actual results could differ materially from those anticipated in the forward-looking statements as a result of specific factors, including the risks and uncertainties described below.

Risk Factors Summary

Below is a summary of the principal factors that make an investment in our common stock speculative or risky:

If we fail to respond to technological developments or evolving industry standards, our solutions may become obsolete or less competitive.

The market in which we participate is highly competitive.

System failures, security breaches, cyberattacks or natural disasters could interrupt the operation of our platform and data centers and significantly harm our business, financial condition and results of operations.

Our solutions rely on integrations with demand- and supply-side advertising platforms, ad servers and social platforms.

Economic downturns and unstable market conditions could adversely affect our business, financial condition and results of operations.

We have completed several acquisitions in the past and may consummate additional acquisitions in the future, which may be difficult to integrate, disrupt our business, expose us to unanticipated liabilities, dilute stockholder value or divert management attention.

We are subject to payment-related risks, and if our ability to accurately and timely collect payments is impaired, our business, financial condition and results of operations may be adversely affected.

Defects, errors or inaccuracies associated with our solutions could negatively impact our business, financial condition and results of operations.

We often have long sales cycles, which can result in significant time between initial contact with a prospect and execution of a contractual agreement, making it difficult to project when, if at all, we will generate revenue from new customers.

We depend on our senior management team and other key personnel to manage our business effectively, and if we are unable to retain such key personnel or hire additional qualified personnel, our ability to compete could be harmed.

22

Table of Contents

Increasing scrutiny and evolving expectations from customers, employees, regulators and other stakeholders with respect to our environmental, social and governance (“ESG”) practices may expose us to new or additional risks.

Data privacy legislation and regulation on digital advertising and privacy and data protection may adversely affect our business.

Public criticism of digital advertising technology in the U.S. and internationally, including digital advertising on social media platforms, could adversely affect the demand for and use of our solutions.

The success of our business depends in large part on our ability to protect and enforce our intellectual property rights.

An assertion from a third party that we are infringing its intellectual property rights, whether such assertion is valid or not, could subject us to costly and time-consuming litigation, expensive licenses or other impacts to our business.

We are exposed to the risks of operating internationally.

Exposure to foreign currency exchange rate fluctuations could negatively impact our results of operations.

Our use of “open source” software could subject our technology to general release or require us to re-engineer our platform, or subject us to litigation, which could harm our business, financial condition and results of operations.

Seasonal fluctuations in advertising activity could have a negative impact on our revenue, cash flow and operating results.

We have a limited operating history, which makes it difficult to evaluate our business and prospects and may increase the risks associated with your investment.

Our revenues and results of operations may fluctuate in the future. As a result, we may fail to meet the expectations of securities analysts or investors, which could cause our stock price to decline.

23

Table of Contents

Risks Relating to Our Business

If we fail to respond to technological developments or evolving industry standards, our solutions may become obsolete or less competitive.

Our future success will depend in part on our ability to develop new solutions and modify or enhance our existing platform in order to meet customer needs, add functionality and address technological advancements. To remain competitive, we will need to continuously upgrade our existing platform and develop new solutions that address evolving technologies and standards across all major channels, formats and devices for digital advertising, including mobile, social, video, in-app, display and connected television, as well as across digital media buying platforms, such as programmatic, direct ad exchanges and trading networks. We may be unsuccessful in upgrading our existing platform or identifying new solutions in a timely or cost-effective manner, or we may be limited in our ability to develop or market new or upgraded solutions due to patents held by others. In addition, any new product innovations may not achieve the market penetration or price levels necessary for profitability. If we are unable to develop timely enhancements to, and new features for, our existing platform or if we are unable to develop new solutions that align with advertiser demands as priorities shift or keep pace with rapid technological developments or changing industry standards, the solutions we deliver may become obsolete, less marketable and less competitive, and our business, financial condition and results of operations may be adversely affected. Further, if our existing and future product offerings fail to maintain or achieve Media Rating Council (“MRC”) or other industry accreditation standards, customer acceptance of our products may decrease.

The market in which we participate is highly competitive.

The market for measurement, data analytics and authentication of digital advertising is competitive and evolving rapidly. As this market evolves, competition may intensify as existing companies expand their businesses and new companies enter the market, which could lead to commoditization and harm our ability to increase revenue and maintain profitability. Our success depends on our ability to retain and grow our existing customers and sell our platform and solutions to new customers. If existing or new companies develop, market or offer competitive products, acquire one of our competitors or form a strategic alliance with one of our competitors or integration partners, our ability to attract new customers or retain existing customers could be adversely impacted and our results of operations could be harmed. In addition, we have partnerships with platforms to allow our customers to utilize our solutions, and these integration partners, some of which have significant market share in the segment in which they operate, could develop products that compete with us in the future. Our current and potential competitors may have more financial, technical, marketing and other resources, as well as longer operating histories and greater name recognition than we do. As a result, these competitors may be better able to respond quickly to new technologies or devote greater resources to the development, promotion, sale and support of their products and services. We cannot assure you that our customers will continue to use our platform or that we will be able to replace, in a timely manner or at all, departing customers with new customers that generate comparable revenue.

We believe that our ability to compete successfully in our market depends on a number of factors, both within and outside of our control, including: (i) the price, quality and effectiveness of our solutions and those of our competitors; (ii) our ability to retain and add new integration partners; (iii) the timing and success of new product introductions; (iv) our position as an independent third-party within the digital advertising ecosystem; (v) the emergence of new technologies; (vi) the number and nature of our competitors; (vii) the protection of our intellectual property rights; (viii) the adoption of new privacy standards or regulations; and (ix) general market and economic conditions. The competitive environment could result in price reductions that could result in lower profits and loss of market share. If we are unable to compete successfully against our current and future competitors, we may not be able to retain and acquire customers and our business, financial condition and results of operations could be adversely affected.

24

Table of Contents

System failures, security breaches, cyberattacks or natural disasters could interrupt the operation of our platform and data centers and significantly harm our business, financial condition and results of operations.

Our success depends on the efficient and uninterrupted operation of our platform. A failure of our computer systems, or those of our demand-side integration partners, could impede access to our platform, interfere with our data analytics, prevent the timely delivery of our solutions or damage our reputation. In the future, we may need to expand our systems at a significant cost and at a more rapid pace than we have to date. We may be unable to provide our solutions on a timely basis or experience performance issues with our platform if we fail to adequately expand or maintain our system capabilities to meet future requirements. Any disruption in our ability to operate our platform will prevent us from providing the solutions requested by our customers and partners, which may damage our reputation and result in the loss of customers or integration partners and the imposition of penalties or other legal or regulatory action, and our business, financial condition and results of operations could be adversely affected.

In delivering our solutions, we are dependent on the operation of our data centers as well as those of third-party service providers whether in cloud or dedicated environments, which are vulnerable to damage or interruption from earthquakes, terrorist attacks, war, floods, fires, power loss, telecommunications failures, computer viruses, computer denial of service attacks or other attempts to harm our system and similar events. Some of our systems are not fully redundant, and our disaster recovery planning cannot account for all eventualities. The occurrence of any issues or failures at our data centers (or the data centers of any of our third party vendors) could result in interruptions in the delivery of our solutions to our customers.

In addition, our ability to operate our platform and deliver our solutions may be interrupted by computer viruses, cyberattacks and security breaches. For example, unauthorized parties have in the past and may attempt in the future to gain access to our information systems and data. Outside parties have in the past and may also attempt in the future to fraudulently induce our employees or users of our platform to disclose sensitive information via illegal electronic spamming, phishing or other tactics. Our IT and security teams regularly review our systems and security measures and evaluate ways to enhance our processes and controls. Nevertheless, we cannot guarantee that a security incident will not occur or that any such incident will be detected or remediated in a timely manner. Any breach of our security measures or the accidental loss, inadvertent disclosure or unauthorized dissemination of proprietary information or sensitive, personal or confidential data about us, our employees or our customers or integration partners, including the potential loss or disclosure of such information or data as a result of hacking, fraud, trickery or other forms of deception, could expose us, our employees, our customers or our integration partners to risks of loss or misuse of this information. Any such breach, loss, disclosure or dissemination may also result in potential liability or fines, governmental inquiry or oversight, litigation or a loss of customer confidence, any of which could harm our business and damage our reputation, possibly impeding our ability to retain and attract new customers, and cause a material adverse effect on our operations and financial condition.

Certain of our third-party service providers and other vendors have access to portions of our IT system. Performance failures or acts of negligence by these service providers may cause material disruptions to our IT systems.

25

Table of Contents

Our solutions rely on integrations with demand- and supply-side advertising platforms, ad servers and social platforms.

Our solutions necessitate that demand- and supply-side advertising platforms, ad servers and social platforms accept and integrate with our technology. We have formed partnerships with these platforms to integrate our technology with their software, allowing our customers to utilize our solutions wherever they purchase or place an ad. These platforms may deploy code or change operations that may impact joint solution and combined functionality, which would have a significant effect on our ability to offer our solutions. Some of these integration partners have significant market share in the segment in which they operate. We can make no assurances that our existing integration partners will continue to, or that potential new integration partners will agree to, integrate our solutions. We also cannot assure you that our customers will continue to use our solutions available on these digital media platforms. Some of our integration partners have developed products that compete with us and we cannot assure you that other partners will not also develop competing products in the future. If our customers stopped using our solutions on these digital media platforms or if our integration partners decide to cease integrating our solutions, our business, financial condition and results of operations could be adversely affected.

Even if our integration partners continue their partnerships with us, we are continuously required to update and enhance our solutions to adapt to changes in software, networking, browser, and database technologies. For example, we may be required to make changes based on a unilateral change that an integration partner makes to its platform in order to integrate our solutions or to have the integration operate in the same manner that it did prior to the integration partner’s change. The integration partner’s change may cause a malfunction in the integration leading to a break in services. We cannot assure you that any updated solutions will be compatible or accepted by our integration partners.

Additionally, some of our integration partners are subject to regulatory actions, which, if successful, could cause our partners to be broken into separate companies. Certain of our partners have been the subject of allegations of taking illegal actions to acquire rivals and stifle competition. If our partners and their products are separated into separate companies, it could have a material effect on our ability to gather data and there can be no assurance that all of the separated companies will continue to be our partners, each of which could materially affect our business, results of operations, and revenues.

Our business, financial condition and results of operations could also be adversely affected by social issues or disruptions. For example, if there is public disapproval or boycotting of a specific platform, our ability to optimize ad placement or to forecast usage may be impacted based on unforeseen trends or events. Additionally, how we categorize specific sites in the course of our normal business operations could expose us to risks from publishers or advertisers who may disagree with our categorizations and incur negative ramifications if they believe their ads were monetarily contributing to websites that contribute to the spread of hate speech, disinformation, white supremacist activity, or voter suppression efforts, among other things. If publishers or advertisers believe our categorizations are faulty or unreliable, they may decrease or cease to use our services, which could affect our business, financial condition and results of operations.

In addition, we rely on our demand-side and social integration partners to report to us on the usage of our solutions on their platforms, as well as revenue generated on their platforms. Any financial, technical or other difficulties our integration partners face may negatively impact our business, as a significant portion of our revenue depends on customers using our solutions on these digital media platforms, and we are unable to predict the nature and extent of any such impact. We exercise very little control over our integration partners, which increases our vulnerability to problems with the services they provide and our reliance upon them for accurate data and revenue reporting. Any errors, failures, interruptions or delays experienced in connection with our integration partners could adversely affect our business, reputation and financial condition.

26

Table of Contents

Economic downturns and unstable market conditions could adversely affect our business, financial condition and results of operations.

Our business depends on the demand for digital advertising measurement and authentication and on the overall economic health of our customers and integration partners. There is no assurance the digital advertising market will experience the growth we anticipate. The health of the digital advertising market and the related measurement and authentication sector is affected by many factors. Current or future economic downturns or unstable market conditions in the markets and geographies that we currently serve, and associated macroeconomic conditions such as growing inflation, rising interest rates, recessionary fears, changes in foreign currency exchange rates, the conditions caused by the 2019 novel coronavirus (“COVID-19”) or other future health pandemics and the impact of geopolitical instability in many parts of the world, may make it difficult for our customers and us to accurately forecast and plan future business activities, and could cause our customers to decrease their advertising budgets or slow the growth of their digital ad spend, which could adversely affect our business, financial condition and results of operations. As we explore new countries to expand our business, economic downturns or unstable market conditions for geo-political or other reasons in any of those countries could result in our investments not yielding the returns we anticipate.

The macroeconomic conditions described above may affect how our customers conduct their businesses and adversely affect our customers’ willingness to utilize our solutions and delay prospective customers’ purchasing decisions. Our customers may decrease their overall advertising budgets as a response to economic uncertainty, a decline in their business activity, and other COVID-19-related impacts on their business or industry.

In response to the COVID-19 pandemic, we have transitioned to a “hybrid” working model, combining both in-office and remote work environments. Remote working arrangements may expose us to increased security risk and privacy concerns and there may be heightened sensitivity from government regulators with respect to privacy compliance in the current environment. Over time, hybrid working arrangements may diminish the cohesiveness of our personnel teams and our ability to maintain our culture, both of which are critical to our success. Hybrid working arrangements may also adversely affect our ability to foster a creative environment, hire additional qualified personnel and retain existing key personnel, any of which could adversely affect our productivity and overall operations. In addition, in-office work environments could expose our employees to health risks, and us to associated liability, and we could incur additional costs. We may also have to close our offices again and return to a work-from-home model if the COVID-19 pandemic worsens or a new pandemic arises. The long-term impacts, if any, of the global COVID-19 pandemic on our business are currently unknown and our business, financial condition and results of operations may be materially impacted.

For further discussion of the impact of the COVID-19 pandemic on our business and financial results, see “Management’s Discussion and Analysis of Financial Condition and Results of Operations — Factors Affecting Our Performance — COVID-19.” To the extent the COVID-19 pandemic adversely affects our business and financial results, it may also have the effect of heightening many of the other risks described in this “Risk Factors” section.

27

Table of Contents

We have completed several acquisitions in the past and may consummate additional acquisitions in the future, which may be difficult to integrate, disrupt our business, expose us to unanticipated liabilities, dilute stockholder value or divert management attention.

We have completed several strategic acquisitions, including of OpenSlate and Meetrics in 2021, Ad-Juster and Zentrick in 2019 and Leiki in 2018. As part of our growth strategy, we regularly evaluate and may consummate additional acquisitions in the future to enhance our technology platform, expand our product offerings, broaden our geographic footprint, or for other strategic reasons. We also may evaluate and enter into discussions regarding an array of potential strategic investments, including acquiring complementary products or technologies. Our recent acquisitions and any future acquisitions or investments may result in unforeseen operating difficulties and expenditures. In particular, we may encounter difficulties integrating the business, technologies, products, personnel or operations of an acquired company, and we may have difficulty retaining the customers or employees of any acquired business due to changes in management and ownership. An acquisition may also disrupt our ongoing business, divert our resources and require significant management attention that would otherwise be available for ongoing growth and development of our business. Moreover, we cannot assure you that the anticipated benefits of an acquisition or investment would be realized in a timely manner, if at all, or that we would not be exposed to unknown costs and liabilities. Acquisitions involve numerous risks, any of which could harm our business and financial performance, including:

the difficulty of assimilating the operations and personnel of the acquired companies;
the potential disruption of our business;
the inability of our management to maximize our financial and strategic position by the successful incorporation of acquired technology into our platform;
unanticipated liabilities associated with an acquisition, including (i) technology, intellectual property and infringement issues, (ii) employment, retirement or severance related claims, (iii) claims by or amounts owed to customers or suppliers, (iv) adverse tax consequences and (v) other legal disputes;
difficulty maintaining uniform standards, controls, procedures and policies, with respect to accounting matters and otherwise;
the potential loss of key personnel of acquired companies;
the impairment of relationships with employees and customers as a result of changes in management and operational structure;
increased indebtedness to finance the acquisition;
entrance into new geographic markets or new product segments that subjects us to different laws and regulations that may have an adverse impact on our business; and
the diversion of management time and focus from operating our business to addressing acquisition integration challenges.

Failure to appropriately mitigate these risks or other issues related to such acquisitions and strategic investments could result in reducing or completely eliminating any anticipated benefits of transactions, and harm our business generally. Future acquisitions could also result in the incurrence or assumption of debt, contingent liabilities, amortization expenses or the impairment of goodwill, any of which could harm our business, financial condition and results of operations. We cannot assure you that we will continue to acquire businesses at attractive valuations or that we will complete future acquisitions at all.

28

Table of Contents

We are subject to payment-related risks, and if our ability to accurately and timely collect payments is impaired, our business, financial condition and results of operations may be adversely affected.

We have a large and diverse customer and integration partner base. At any given time, one or more of our customers or partners may experience financial difficulty, file for bankruptcy protection or cease operations. Unfavorable economic and financial conditions could result in an increase in customer or partner financial difficulties which could adversely affect us. Our clients have in the past, and may in the future, dispute the way we calculate billing for our solutions. If we are unable to resolve such disputes, we may lose clients or clients may decrease their use of our solutions and our financial performance and growth may be adversely affected. The direct impact on us could include reduced revenues and write-offs of accounts receivable and expenditures billable to customers, and if these effects were severe enough, the indirect impact could include impairments of intangible assets and reduced liquidity. Furthermore, the payment risks we face are heightened since (i) our programmatic and certain other partners collect payments from all of our advertiser customers utilizing their platform and remit to us such amounts on behalf of these advertiser customers and (ii) media agencies pay us on behalf of multiple customers who utilize them, each of whom are subject to independent billing and payment risks as well. Although no customer accounted for more than 10% of our revenue in 2022, two programmatic partner platforms collected approximately 17% and 14% each of our total revenue in 2022 on behalf of our advertiser customers using their platforms.

In addition, each of our customers and integration partners may have different payment methods and cycles. The timing of receipt of payment from our customers and integration partners may impact our cash flows and working capital.

Defects, errors or inaccuracies associated with our solutions could negatively impact our business, financial condition and results of operations.

The technology underlying our platform may contain material defects or errors. If the data analytics we deliver to our customers are inaccurate or perceived to be inaccurate, due to defects or errors in our technology, our business may be harmed. Any inaccuracy or perceived inaccuracy in the solutions we provide could lead to consequences that adversely impact our business, financial condition and results of operations, including:

loss of customers;
the incurrence of substantial costs to correct any material defect or error;
potential litigation;
interruptions in the availability of our platform;
diversion of development resources;
loss of MRC or other industry accreditation;
lost sales or delayed market acceptance of our solutions; and
damage to our brand.

29

Table of Contents

We often have long sales cycles, which can result in significant time between initial contact with a prospect and execution of a contractual agreement, making it difficult to project when, if at all, we will generate revenue from new customers.

Our sales cycle, from initial contact to contract execution and implementation, is often long and time consuming. Our sales efforts involve educating our customers about the use, technical capabilities and benefits of our software platform. Some of our customers undertake an evaluation process that involves reviewing the offerings of our competitors in addition to our platform. As a result, it is difficult to predict when a prospective customer will decide to execute an agreement and begin generating revenue for us. Even if our sales efforts result in obtaining a new customer, under our usage-based pricing model for most of our solutions, the customer controls when and to what extent it uses our platform. As a result, we may not be able to add customers or generate revenue as quickly as we may expect.

We depend on our senior management team and other key personnel to manage our business effectively, and if we are unable to retain such key personnel or hire additional qualified personnel, our ability to compete could be harmed.

Our company is led by a strong management team that has extensive experience leading technology and digital marketing companies. Our success and future growth depend to a significant degree on the leadership, knowledge, skills and continued services of our senior management team and other key personnel. The loss of any of these persons could adversely affect our business.

Our future success also depends on our ability to retain, attract and motivate highly skilled technical, managerial, marketing and customer service personnel. We have increased the size of our workforce by more than 50% since 2020 to 902 employees and expect to continue to grow in the near term. We may incur significant costs to attract and retain qualified employees, including significant expenditures related to salaries and benefits and compensation expenses related to equity awards. Providing equity compensation to employees through our equity compensation program is critical to maintaining our attractiveness as an employer in the technology industry. If there is volatility in our stock price, or new regulations relating to employee equity compensation, it may harm our ability to attract and retain qualified employees. New regulations that prohibit the use of certain restrictive covenants in agreements with our employees could impact our ability to retain existing employees. Further, new employees often require significant training and we may lose new or existing employees to our competitors or other companies before we realize the benefit of our investment in recruiting and training them. In addition, changes to labor and immigration laws and regulations may adversely affect our access to technical and professional talent.

Competition for personnel is intense, particularly those with technological expertise and our key areas of operations, including New York, Tel Aviv, Singapore, Berlin and London. A substantial majority of our employees work for us on an at-will basis, and we may experience a loss of productivity due to the departure of key personnel and the associated loss of institutional knowledge. Our inability to retain and attract the necessary personnel could adversely affect our business, financial condition and results of operations.

In addition, our international expansion has led to an increasing number of employees based in countries outside of North America. As a result, we may experience increased competition for employees outside of North America as the trend toward globalization continues, which may impact our employee retention and increase our compensation expenses as we endeavor to attract and retain qualified employees globally. With 348 employees based outside of the Americas as of December 31, 2022, including 108 employees in our Tel Aviv office and 70 employees in our London office, we are exposed to a number of additional country-specific risks. See “We are exposed to the risks of operating internationally.”

30

Table of Contents

Increasing scrutiny and evolving expectations from customers, employees, regulators and other stakeholders with respect to our environmental, social and governance (“ESG”) practices may expose us to new or additional risks.

Customers, employees, governmental organizations, investors, proxy advisory services and other stakeholders are increasingly focused on ESG practices. While we are working to enhance our ESG efforts and related disclosures, if our stakeholders assess that our ESG efforts do not meet their expectations, which may continue to evolve, or we fail (or are perceived to fail) to meet the standards we set for our organization, our reputation, hiring initiatives, employee retention and customer and supplier relationships may be adversely affected. We may also incur significant costs and resources to monitor, report, and comply with various ESG initiatives, laws and regulations. New laws and regulations relating to ESG matters, including sustainability, climate change, human capital and diversity, are being developed in the United States, Europe and elsewhere. These laws and regulations may require considerable investment, including through the potential adoption of target-driven frameworks or disclosure requirements. Any failure, or perceived failure, by us to adhere to our stated ESG goals, comply fully with developing ESG law and regulation or failure to satisfy stakeholders with our ESG practices or the speed at which we implement them could harm our business, reputation, financial condition and operating results.

Data privacy legislation and regulation on digital advertising and privacy and data protection may adversely affect our business.

There are a growing number of data privacy and protection laws and regulations in the digital advertising industry that apply to our business. We have dedicated, and expect to continue to dedicate, significant resources in our efforts to comply with such laws and regulations. For example, we have implemented policies and procedures to comply with applicable data privacy laws and regulations and rely on contractual representations made to us by customers and partners that the information they provide to us and their use of our solutions do not violate these laws and regulations or their own privacy policies. However, the application, interpretation and enforcement of these laws and regulations are often uncertain and continue to evolve, particularly in the new and rapidly evolving industry in which we operate, and may be interpreted and applied inconsistently between states within a country or between countries, and our current policies and practices may be found not to comply. Additionally, if our customers and partners’ representations are false or inaccurate, or if our customers and partners do not otherwise comply with applicable privacy laws, we could face adverse publicity and possible legal or regulatory action. Conversely, our partners and communications services providers have adopted their own policies based on their own perceptions of legal requirements or other policy determinations, and these policies have in the past temporarily prevented us, and may again in the future prevent us, from operating on their platforms and possibly result in loss of business or litigation. Any perception of our practices, platform or solutions delivery as a violation of privacy rights may subject us to public criticism, loss of customers or partners, class action lawsuits, reputational harm, or investigations or claims by regulators, industry groups or other third parties, all of which could significantly disrupt our business and expose us to liability in ways that negatively affect our business, results of operations and financial condition.

31

Table of Contents

In addition, U.S. and foreign governments have enacted or are considering enacting new legislation related to privacy, data protection, data security and digital advertising and we expect to see an increase in, or changes to, legislation and regulation that affects our industry. For example, the EU’s General Data Protection Regulation (“GDPR”), which became effective on May 25, 2018, and has resulted and will continue to result in significantly greater compliance burdens and costs for companies with users and operations in the EU and European Economic Area (“EEA”). Under GDPR, fines of up to 20 million Euros or up to 4% of the annual global revenues of the infringing party, whichever is greater, can be imposed for violations. The GDPR imposes several stringent requirements for controllers and processors of personal data and could make it more difficult and/or more costly for us to use and share personal data. In addition, the California Consumer Privacy Act (“CCPA”), which went into effect on January 1, 2020, limits how we may collect and use personal data. The effects of the CCPA potentially are far-reaching and may require us to modify our data processing practices and policies and incur substantial compliance-related costs and expenses. In November 2020, California voters passed the California Privacy Rights and Enforcement Act (“CPRA”), which expands the CCPA with additional data privacy compliance requirements that go into effect on January 1, 2023 and may impact our business, and establishes a regulatory agency dedicated to enforcing those requirements. Other states have also recently introduced or enacted comprehensive consumer privacy laws that broadly protect personal data, including the right to opt out of targeted advertising and certain profiling activities, and more states are expected to follow. It remains unclear how various provisions of the CCPA, CPRA and other state laws will be interpreted and enforced. Further, the Children’s Online Privacy Protection Act (“COPPA”) applies to websites and other online services that are directed to children under thirteen (13) years of age and imposes certain restrictions on the collection, use and disclosure of personal information from these websites and online services. Additionally, a data transfer mechanism we rely on called Standard Contractual Clauses has been subjected to regulatory and judicial scrutiny, particularly after a transfer framework for data transferred from the EU to the United States called the Privacy Shield was invalidated by the Court of Justice of the European Union, although they remain valid. Although in 2022 EU and U.S. officials announced an agreement on “Privacy Shield 2.0” had been reached, it has not yet been officially adopted by the European Union. The continued uncertainty around the feasibility of onward transfers from the EU to the United States has the potential to adversely affect our operations and business. These and other data privacy laws and their interpretations continue to develop and may be inconsistent from jurisdiction to jurisdiction. Noncompliance with these laws could result in penalties or significant legal liability. Although we take reasonable efforts to comply with all applicable laws and regulations, there can be no assurance that we will not be subject to regulatory action, including fines, in the event of an incident. We or our third-party service providers could be adversely affected if legislation or regulations are expanded to require changes in our or our third-party service providers’ business practices or if governing jurisdictions interpret or implement their legislation or regulations in ways that negatively affect our or our third-party service providers’ business, results of operations or financial condition. These federal, state and foreign laws and regulations, which in some cases can be enforced by private parties in addition to government entities, are increasingly restricting the collection, processing and use of personal data.

These laws are constantly evolving and can be subject to significant change or interpretive application. We continue to monitor changes in laws and regulations, and the costs of compliance with, and the other burdens imposed by, these and other new laws or regulatory actions may increase our costs. In addition, failure to comply with these and other laws and regulations may result in, among other things, administrative enforcement actions and significant fines, class action lawsuits, significant legal fees, and civil or criminal liability. Any regulatory or civil action that is brought against us, even if unsuccessful, may distract our management’s attention, divert our resources, negatively affect our public image or reputation among our customers and partners and within our industry, and, consequently, harm our business, results of operations and financial condition.

32

Table of Contents

Public criticism of digital advertising technology in the U.S. and internationally, including digital advertising on social media platforms, could adversely affect the demand for and use of our solutions.

Our business depends, in part, on the demand for digital advertising technology. The digital advertising industry has been and may in the future be subject to reputational harm, negative media attention and public complaint relating to, among other things, the alleged lack of transparency and anti-competitive behavior among advertising technology companies. This public criticism could result in increased data privacy and anti-trust regulation in the digital advertising industry in the U.S. and internationally. In addition, our services are delivered in web browsers, mobile apps and other software environments where online advertising is displayed, and certain of these environments have announced future plans to phase out or end the use of cookies and other third-party tracking technology on their operating systems in order to provide more consumer privacy. While our core technology and solutions do not rely on persistent identifiers or cookie-based or cross-site tracking, these changes and other updates to software functionality in these environments could hurt our ability to effectively deliver our services and make them less effective if our services are restricted from operating. We have also experienced significant growth in social media-related revenues and generate significant revenue from the use of our solutions on social media platforms, which have been and may in the future be the subject of avoidance campaigns or similar events, including ad boycotts on Facebook and Twitter. Any change or decrease in the demand for digital advertising, including on social media platforms as a result of avoidance campaigns or similar events, may negatively affect the demand for and use of our solutions. If our customers significantly reduce or eliminate their digital ad spend in response to the public criticism of the digital advertising industry or its related effects, our business, financial condition and results of operations could be adversely affected.

The success of our business depends in large part on our ability to protect and enforce our intellectual property rights.

We rely on a combination of intellectual property rights in our business and rely on patent, copyright, service mark, trademark and trade secret laws, as well as confidentiality procedures and contractual restrictions, to establish and protect our proprietary rights, all of which provide limited protection. We endeavor to enter into agreements with our employees and contractors and with parties with whom we do business in order to limit access to and disclosure of our proprietary information. We cannot be certain that the steps we have taken will prevent unauthorized use of our technology or the reverse engineering of our technology. We cannot make assurances that any additional patents will be issued with respect to any of our pending or future patent applications, that any patents issued to us will provide adequate protection, or that any patents issued to us will not be challenged, invalidated, circumvented, or held to be unenforceable in actions against alleged infringers. Also, we cannot make assurances that any future trademark or service mark registrations will be issued with respect to pending or future applications or that any of our registered trademarks and service marks will be enforceable or provide adequate protection of our proprietary rights. In addition, the laws of some foreign countries where our platform is utilized do not protect our proprietary rights to the same extent as do the laws of the United States. A failure to protect our intellectual property rights in the U.S. or elsewhere could adversely affect our business, financial condition and results of operations.

33

Table of Contents

An assertion from a third party that we are infringing its intellectual property rights, whether such assertion is valid or not, could subject us to costly and time-consuming litigation, expensive licenses or other impacts to our business.

There is significant intellectual property development activity in the measurement and authentication of digital ads. Third-party intellectual property rights may cover significant aspects of our technologies or business methods or block us from expanding our platform and delivering new solutions, and we cannot be certain that our current operations do not infringe the rights of a third party. We have received and may continue to receive allegations and/or claims from third parties that our technology infringes or violates such third parties’ intellectual property rights. The cost of defending against such claims, whether or not the claims have merit, is significant and could divert the attention of management, technical personnel and other employees from our business operations. Litigation regarding intellectual property rights is inherently uncertain due to the complex issues involved, and we may not be successful in defending ourselves in such matters. Additionally, we may be obligated to indemnify our customers or partners in connection with any such litigation. Intellectual property claims could harm our relationships with our customers and deter future customers from buying our solutions or expose us to litigation. If we are found to infringe intellectual property rights, we could potentially be subject to injunctive or other relief that could affect our ability to provide our solutions. We may also be required to develop alternative non-infringing technology and may be unable to do so, or such development may require significant time and expense and may not be successful. In addition, we could be required to pay royalty payments, either as a one-time fee or ongoing, as well as damages for past use that was deemed to be infringing. If we cannot license or develop technology for any allegedly infringing aspect of our business, this may limit our platform and solutions, and we may be unable to compete effectively. Any of these results could adversely affect our business, financial condition and results of operations.

We are exposed to the risks of operating internationally.

Our international operations are important to our current and future strategy, growth and prospects. We currently have operations in numerous foreign countries, including the United Kingdom, Israel, Singapore, Australia, Brazil, Mexico, France, Germany, Finland, Belgium and Japan, and expect to continue to expand our operations internationally. Our international operations are subject to varying degrees of regulation in each of the jurisdictions in which our services are provided. Local laws and regulations, and their interpretation and enforcement, differ significantly among those jurisdictions, and can change significantly over time. Some of the risks inherent in conducting business internationally include:

the complexities and expense of complying with a wide variety of foreign and domestic laws and regulations applicable to international operations, including privacy and data protection laws and regulations, the U.S. Foreign Corrupt Practices Act and other applicable anti-corruption and anti- bribery laws;
difficulties in staffing and managing international operations, including complex and costly hiring and termination requirements;
reduced or varied protection for intellectual property rights in some countries;
challenges caused by distance, language and cultural differences;
political, social and economic instability abroad, terrorist attacks and security concerns;
trade disruptions or political tensions between the U.S. and foreign countries (including as a result of Russia’s invasion of Ukraine);
fluctuations in currency exchange rates;
potentially adverse tax consequences and the complexities of foreign value-added taxes and the repatriation of earnings;

34

Table of Contents

increased accounting and reporting burdens and complexities; and
difficulties and expenses associated with tailoring our platform and solutions to local markets as may be required by local customers, regulations and local industry organizations.

In addition, we have a research and development center located in Tel Aviv, Israel, with a significant presence of software and data engineers and employees focused on product development. Political, economic, and military conditions in Israel and the surrounding region, and any hostilities involving Israel or the interruption of trade between Israel and its trading partners, could adversely affect our business and operations for a period of time.

Our ability to manage our business and conduct our operations internationally also requires considerable management attention and financial resources. We cannot be certain that the investments and additional resources required for establishing and maintaining operations in other countries will hold their value or produce desired levels of revenues or profitability. Any one or more of these factors could negatively impact our international operations and thus adversely affect our business, financial condition and results of operations.

Exposure to foreign currency exchange rate fluctuations could negatively impact our results of operations.

While the majority of our transactions are denominated in U.S. dollars, we frequently transact in foreign currencies, including for payments from clients, expenses and acquisition costs. We also have expenses denominated in currencies other than the U.S. dollar. Given our investment in international growth, we expect the number of our foreign currency transactions to increase in the future. Foreign currency exchange rate fluctuations could cause our operating results to differ materially from expectations.

Our use of “open source” software could subject our technology to general release or require us to re-engineer our platform, or subject us to litigation, which could harm our business, financial condition and results of operations.

Some of our technology incorporates so-called “open source” software, and we may incorporate additional open source software in the future. Open source software is generally licensed by its authors or other third parties under open source licenses, which typically do not provide for any representations, warranties or indemnity coverage by the licensor. Some of these licenses provide that combinations of open source software with a licensee’s proprietary software are subject to the open source license and require that the combination be made available to third parties in source code form or at no cost. Some open source licenses may also require the licensee to grant licenses under certain of its intellectual property to third parties. Additionally, there is little case law interpreting such licenses and there is a risk that open source licenses could be construed in a manner that imposes unanticipated conditions or restrictions on our ability to provide our platform. If a third party that distributes open source software were to allege that we had not complied with the conditions of one or more of these licenses, we could be required to incur significant legal expenses defending against such allegations and could be subject to significant damages, enjoined from the sale of our solutions that contain the open source software and required to comply with the foregoing conditions, which could disrupt the distribution and sale of some of our solutions. In addition, we may be forced to re-engineer our platform or discontinue use of certain open source software, and related solutions provided by our platform that use such open source software. Any of these events could adversely affect our business, financial condition and results of operations.

Seasonal fluctuations in advertising activity could have a negative impact on our revenue, cash flow and operating results.

Our revenue, cash flow, operating results and other key operating and performance metrics may vary from quarter to quarter due to the seasonal nature of our customers’ spending on advertising campaigns. For example, advertisers typically allocate the largest portion of their media budgets to the fourth quarter of the calendar year in order to coincide with increased holiday purchasing. As a result, the fourth quarter of the year typically reflects our highest level of measurement activity while the first quarter reflects the lowest level of such activity. Our historical revenue growth has masked the impact of seasonality, but if our growth rate declines or seasonal spending becomes more pronounced, seasonality could have a more significant impact on our revenue, cash flow and operating results from period to period.

35

Table of Contents

We have a limited operating history, which makes it difficult to evaluate our business and prospects and may increase the risks associated with your investment.

Our business was founded in 2008 and, as a result, we have a limited operating history upon which our business and prospects may be evaluated. Although we have experienced substantial revenue growth in our limited operating history, we may not be able to sustain this rate of growth or maintain our current revenue levels. We have encountered and will continue to encounter risks and challenges frequently experienced by rapidly growing companies in developing industries, including risks related to our ability to:

build a reputation for providing superior customer service and for creating trust and long-term relationships with our customers;
distinguish ourselves from competitors;
scale our business efficiently;
maintain and expand our relationships with customers and partners;
respond to evolving industry standards and government regulation that impact our business, particularly in the areas of data privacy;
respond to technological advances;
prevent or mitigate security failures or breaches;
expand our business internationally; and
hire and retain qualified employees.

We cannot assure you that we will be successful in addressing these and other challenges we may face in the future. If we are unable to do so, our business may suffer, our revenue and operating results may decline and we may not be able to achieve further growth or sustain profitability.

We are subject to taxation in multiple jurisdictions. Any adverse development in the tax laws of any of these jurisdictions or any disagreement with our tax positions could have a material and adverse effect on our business, financial condition or results of operations.

We are subject to taxation in, and to the tax laws and regulations of, multiple jurisdictions as a result of the international scope of our operations and our corporate entity structure. Adverse developments in these laws or regulations, or any change in position regarding the application, administration or interpretation thereof, in any applicable jurisdiction, could have a material and adverse effect on our business, financial condition or results of operations. For example, the Tax Cuts and Jobs Act of 2017 eliminated the option to deduct research and development expenditures in the current period and requires taxpayers to capitalize and amortize these expenses effective January 1, 2022. Although the U.S. Congress may consider legislation that would defer the capitalization and amortization requirement, there is no assurance that the provision will be repealed or otherwise modified. In addition, the tax authorities in any applicable jurisdiction, including the U.S., may disagree with the positions we have taken or intend to take regarding the tax treatment or characterization of any of our transactions.

36

Table of Contents

Our revenues and results of operations may fluctuate in the future. As a result, we may fail to meet the expectations of securities analysts or investors, which could cause our stock price to decline.

Our results of operations may fluctuate as a result of a variety of factors, many of which are outside of our control. If our revenues or results of operations do not meet the expectations of securities analysts or investors, the price of our common stock could decline. Factors that may cause fluctuations in our revenues or results of operations include:

our ability to retain and grow relationships with existing customers and attract new customers;
the loss of demand-side platforms as integration partners;
the timing and success of new product introductions, including the introduction of new technologies or offerings, by us, our competitors or others in the advertising marketplace;
changes in the pricing of our solutions or those of our competitors;
our failure to accurately estimate or control costs, including those incurred as a result of investments, other business or product development initiatives and the integration of acquired businesses;
multi-year commitments with minimum purchase requirements;
the effects of acquisitions and their integration;
changes and uncertainty in the regulatory environment;
the amount and timing of capital expenditures and operating costs related to the maintenance and expansion of our operations and infrastructure;
service outages, other technical difficulties or security breaches;
limitations relating to the capacity of our networks, systems and processes;
maintaining appropriate staffing levels and capabilities relative to projected growth, or retaining key personnel;
the risks associated with operating internationally; and
general economic, political, regulatory, industry and market conditions and those conditions specific to internet usage and digital media.

Based upon the factors above and others both within and beyond our control, we have a limited ability to forecast our future revenue, costs and expenses, and as a result, our operating results may, from time to time, fall below our estimates or the expectations of analysts and investors. We believe that our revenues and results of operations on a year-over-year and sequential quarter-over-quarter basis may vary significantly in the future. Investors are cautioned not to rely on the results of prior periods as an indication of future performance.

37

Table of Contents

Our estimates of market opportunity and forecasts of market growth included in this Annual Report on Form 10-K may prove to be inaccurate.

Market opportunity estimates and growth forecasts are subject to significant uncertainty and are based on assumptions and estimates that may not prove to be accurate. Our estimates and forecasts relating to the size and expected growth of our market may prove to be inaccurate. For example, the digital advertising industry may not grow at the rate that we currently expect, the migration of advertising from linear television to CTV may not occur on the scale we currently anticipate, or the growth of subscription media platforms as opposed to platforms supported by advertising may all impact the estimates and growth forecasts we have included in this Annual Report on Form 10-K. Even if the market in which we compete meets our size estimates and forecasted growth, our business could fail to grow at similar rates, if at all.

Our financial condition and results of operations could be adversely affected if we incur an impairment of goodwill or other intangible and long-lived assets.

As of December 31, 2022, we had $343.0 million of goodwill and $248.9 million of other long-lived assets, including property, plant and equipment and intangible assets. We are required to test intangible assets and goodwill annually and on an interim basis if an event occurs or there is a change in circumstance that would more likely than not reduce the fair value below its carrying values or indicate that the carrying value of such intangibles is not recoverable. When the carrying value exceeds its fair value, an impairment loss is recognized in an amount equal to that excess. If the carrying amount of an intangible asset is not recoverable, a charge to operations is recognized. Either event would result in incremental expenses for that period, which would reduce any earnings or increase any loss for the period in which the impairment was determined to have occurred.

Our impairment analysis is sensitive to changes in key assumptions used in our analysis, such as expected future cash flows. Additionally, changes in our strategy or significant technical developments could significantly impact the recoverability of our intangible assets. If the assumptions used in our analysis are not realized, it is possible that an impairment charge may need to be recorded in the future. We identified impairment of long-lived assets of $1.5 million for the year ended December 31, 2022. We did not identify impairment of goodwill or long-lived assets for the years ended December 31, 2021 or December 31, 2020. We cannot predict the amount and timing of any future impairment of goodwill or other intangible assets.

See Note 5 to our audited consolidated financial statements included elsewhere in this Annual Report on Form 10-K for further discussion on the goodwill recognized from our recent acquisitions.

Restrictions in the New Revolving Credit Facility could adversely affect our business, financial condition and results of operations.

The operating and financial restrictions and covenants in the New Revolving Credit Facility, and any future financing agreements, could restrict the ability of DoubleVerify MidCo, Inc., DoubleVerify Inc. and their respective subsidiaries (the “Credit Group”) to finance future operations or capital needs or to expand or pursue the Credit Group’s business activities. The New Revolving Credit Facility contains limitations on the ability of the Credit Group to, among other things:

pay dividends or purchase, redeem or retire capital stock;
grant liens;
incur or guarantee additional debt;
make investments and acquisitions;
enter into transactions with affiliates;

38

Table of Contents

enter into any merger, consolidation or amalgamation or dispose of all or substantially all property or business; and
dispose of property, including issuing capital stock.

The New Revolving Credit Facility also contains covenants requiring the Credit Group to maintain certain financial ratios. The Credit Group’s ability to meet those financial ratios can be affected by events beyond our control, and we cannot assure you that the Credit Group will meet any such ratios in the future.

The New Revolving Credit Facility is secured by substantially all of the assets (subject to customary exceptions) of the Credit Group. A failure to comply with the provisions of the New Revolving Credit Facility could result in a default or an event of default that could enable our lenders to declare the outstanding principal amount of that debt, together with accrued and unpaid interest, to be immediately due and payable. We might not have, or be able to obtain, sufficient funds to make these accelerated payments. If the payment of our debt is accelerated and we do not have sufficient cash available to repay such indebtedness, the lenders could enforce their security interests and liquidate some or all of the secured assets of the Credit Group to repay the outstanding principal and interest, and our stockholders could experience a partial or total loss of their investment. For more information about the New Revolving Credit Facility, see Note 9 to our audited consolidated financial statements included elsewhere in this Annual Report on Form 10-K.

In the future, we may need to obtain additional financing that may not be available or may reduce our profitability or result in dilution to our stockholders.

We may require additional capital in the future to develop and execute our long-term growth strategy. We believe our existing cash and cash generated from operations, together with the undrawn balance under the New Revolving Credit Facility, will be sufficient to meet our working capital and capital expenditure requirements for at least the next 12 months. However, we may need to raise additional funds in the future in order to, among other things:

finance working capital requirements, capital investments or refinance existing or future indebtedness;
acquire complementary businesses, technologies or products;
develop or enhance our technological infrastructure and our existing platform and solutions;
fund strategic relationships; and
respond to competitive pressures.

If we incur additional indebtedness, our profitability may be reduced. Any future indebtedness could be at higher interest rates and may require us to comply with restrictive covenants, which could place limitations on our business operations. Further, we may not be able to maintain sufficient cash flows from our operating activities to service our existing and any future indebtedness. If our operating results are not sufficient to service any future indebtedness, we will be forced to take actions such as reducing or delaying our business activities, investments or capital expenditures, selling assets or issuing equity. If we issue additional equity securities, our stockholders may experience significant dilution and the price of our common stock may decline. Alternatively, if adequate funds are not available or are not available on acceptable terms, our ability to fund our strategic initiatives, take advantage of unanticipated opportunities, develop or enhance our technology or services or otherwise respond to competitive pressures could be significantly limited.

39

Table of Contents

Risks Related to Our Common Stock

The market price of our common stock may be volatile and could decline regardless of our operating performance.

The market price of our common stock may fluctuate significantly based on a number of factors that are outside of our control. Among the factors that could affect our stock price are:

actual or anticipated fluctuations in our quarterly operating results;
changes in securities analysts’ estimates of our financial performance or lack of research coverage and reports by industry analysts;
actions by institutional stockholders or other large stockholders (including Providence), including future sales of our common stock;
failure to meet any guidance given by us or any change in any guidance given by us, or changes by us in our guidance practices;
industry, regulatory or general market conditions;
domestic and international economic factors unrelated to our performance;
changes in our customers’ or partners’ preferences;
changes in law or regulation;
lawsuits, enforcement actions and other claims by third parties or governmental authorities;
adverse publicity related to us or another industry participant;
announcements by us of significant impairment charges;
speculation in the press or investment community;
investor perception of us and our industry;
changes in market valuations or earnings of similar companies;
announcements by us or our competitors of significant contracts, acquisitions, dispositions or strategic partnerships;
war (including Russia’s invasion of Ukraine), terrorist acts and epidemic disease (including the COVID-19 pandemic);
any future offerings of our common stock or other securities;
additions or departures of key personnel; and
misconduct or other improper actions of our employees.

40

Table of Contents

In particular, we cannot assure you that you will be able to resell your shares at or above your purchase price. Stock markets have experienced extreme volatility in recent years that has been unrelated to the operating performance of particular companies. These broad market fluctuations may adversely affect the trading price of our common stock.

DoubleVerify is a holding company with no operations of its own, and it depends on its subsidiaries for cash to fund all of its operations and expenses, including to make future dividend payments, if any.

Our operations are conducted entirely through our subsidiaries, and our ability to generate cash to fund our operations and expenses, to pay dividends or to meet debt service obligations is highly dependent on the earnings and the receipt of funds from our subsidiaries through dividends or intercompany loans. Deterioration in the financial condition, earnings or cash flow of DoubleVerify and its subsidiaries for any reason could limit or impair their ability to pay such distributions. Additionally, to the extent our subsidiaries are restricted from making such distributions under applicable law or regulation or under the terms of our existing or future financing arrangements, or are otherwise unable to provide funds to the extent of our needs, there could be a material adverse effect on our business, financial condition or results of operations.

Future sales of shares by us or our existing stockholders could cause our stock price to decline.

Sales of substantial amounts of our common stock in the public market, including by Providence, or the perception that these sales could occur, could cause the market price of our common stock to decline. These sales, or the possibility that these sales may occur, also might make it more difficult for us to sell equity securities in the future at a time and at a price that we deem appropriate.

In the future, we may issue additional shares of common stock or other equity or debt securities convertible into or exercisable or exchangeable for shares of our common stock in connection with a financing, strategic investment, litigation settlement or employee arrangement or otherwise. Any of these issuances could result in substantial dilution to our existing stockholders and could cause the trading price of our common stock to decline.

If securities or industry analysts do not publish research or publish misleading or unfavorable research about our business, our stock price and trading volume could decline.

The trading market for our common stock depends in part on the research and reports that securities or industry analysts publish about us or our business. If one or more research analysts downgrades our stock or publishes misleading or unfavorable research about our business, our stock price would likely decline. If one or more of the analysts ceases coverage of our common stock or fails to publish reports on us regularly, demand for our common stock could decrease, which could cause our common stock price or trading volume to decline.

Providence has significant influence over us and may not always exercise its influence in a way that benefits our public stockholders.

Providence VII U.S. Holdings L.P. owns approximately 40% of the outstanding shares of our common stock. As a result, Providence will continue to exercise significant influence over all matters requiring stockholder approval for the foreseeable future, including approval of significant corporate transactions, which may reduce the market price of our common stock.

Because Providence’s interests may differ from your interests, actions Providence takes as a stockholder with significant influence may not be favorable to you. For example, the concentration of ownership held by Providence could delay, defer or prevent a change of control of us or impede a merger, takeover or other business combination that another stockholder may otherwise view favorably. Other potential conflicts could arise, for example, over matters such as employee retention or recruiting, or our dividend policy.

41

Table of Contents

Furthermore, by holding approximately 40% of our common stock, Providence generally will be able to determine the outcome of corporate actions requiring stockholder approval, including the election of the members of our board of directors and the approval of significant corporate transactions, such as mergers and the sale of substantially all of our assets. Additionally, Providence will continue to have the right to designate for nomination for election one or more of our directors so long as it beneficially owns at least 5% of our common stock.

Under our amended and restated certificate of incorporation, Providence and its affiliates and, in some circumstances, any of our directors and officers who is also a director, officer, employee, member or partner of Providence and its affiliates, have no obligation to offer us corporate opportunities.

The policies relating to corporate opportunities and transactions with Providence set forth in our second amended and restated certificate of incorporation (the “amended and restated certificate of incorporation”) addresses potential conflicts of interest between DoubleVerify, on the one hand, and Providence and its officers, directors, employees, members or partners who are directors or officers of our company, on the other hand. In accordance with those policies, Providence may pursue corporate opportunities, including acquisition opportunities that may be complementary to our business, without offering those opportunities to us. By being a stockholder in DoubleVerify, you are deemed to have notice of and to have consented to these provisions of our amended and restated certificate of incorporation. Although these provisions are designed to resolve conflicts between us and Providence and its affiliates fairly, conflicts may not be resolved in our favor or be resolved at all.

Future offerings of debt or equity securities which would rank senior to our common stock may adversely affect the market price of our common stock.

If we decide to issue debt or equity securities that rank senior to our common stock, it is likely that such securities will be governed by an indenture or other instrument containing covenants restricting our operating flexibility. Additionally, any convertible or exchangeable securities that we issue in the future may have rights, preferences and privileges more favorable than those of our common stock and may result in dilution to owners of our common stock. We and, indirectly, our stockholders, will bear the cost of issuing and servicing such securities. Because our decision to issue debt or equity securities in any future offering will depend on market conditions and other factors beyond our control, we cannot predict or estimate the amount, timing or nature of any future offerings. Thus, holders of our common stock will bear the risk of our future offerings reducing the market price of our common stock or diluting their ownership stake in us.

Fulfilling our obligations incident to being a public company, including compliance with the Exchange Act and the requirements of the NYSE, the Sarbanes-Oxley Act and the Dodd-Frank Act, is expensive and time- consuming, and any delays or difficulties in satisfying these obligations could have a material adverse effect on our future results of operations and our stock price.

As a public company, we are subject to the reporting, accounting and corporate governance requirements of the NYSE, the Exchange Act, the Sarbanes-Oxley Act and Section 619 of the Dodd-Frank Act that apply to issuers of listed equity, which impose certain significant compliance requirements, costs and obligations upon us. The requirements of being a publicly listed company require a significant commitment of resources and management oversight which increase our operating costs. These laws and regulations also could make it more difficult or costly for us to obtain certain types of insurance, including director and officer liability insurance, and we may be forced to accept reduced policy limits and coverage or incur substantially higher costs to obtain the same or similar coverage. These laws and regulations could also make it more difficult for us to attract and retain qualified persons to serve on our board of directors, our board committees or as our executive officers.

The expenses associated with being a public company include increased auditing, accounting and legal fees and expenses, investor relations expenses, increased directors’ fees and director and officer liability insurance costs, registrar and transfer agent fees and NYSE listing fees, as well as other expenses, which we expect to further increase now that we are no longer an “emerging growth company.” Based on the market value of our common stock held by non-affiliates as of June 30, 2022, we ceased to be an “emerging growth company” on December 31, 2022. Failure to comply with the requirements of being a public company could potentially subject us to sanctions or investigations by the SEC, the NYSE or other regulatory authorities, delisting of our common stock, and potentially civil litigation.

42

Table of Contents

Additionally, the Sarbanes-Oxley Act requires, among other things, that we maintain effective disclosure controls and procedures and internal control over financial reporting. In order to maintain and improve the effectiveness of such controls, we have expended, and anticipate that we will continue to expend, significant resources. For example, since our IPO, we have hired additional accounting and financial staff with appropriate public company experience and technical accounting knowledge to assist in our compliance efforts.

We have incurred and expect to continue to incur significant expenses and devote substantial management effort toward compliance with the auditor attestation requirements of Section 404 of the Sarbanes-Oxley Act. To assist us in complying with these requirements we may need to hire more employees in the future, or engage outside consultants, which will increase our operating expenses.

Despite significant investment, our current controls and any new controls that we implement may become inadequate because of changes in business conditions. For example, because we have acquired companies in the past and may continue to do so in the future, we need to effectively expend resources to integrate the controls of these acquired entities with ours. Further, weaknesses in our disclosure controls and internal control over financial reporting may be discovered in the future. Any failure to implement and maintain effective internal control over financial reporting could adversely affect the results of periodic management evaluations and annual independent registered public accounting firm attestation reports regarding the effectiveness of our internal control over financial reporting that are required to be included in the periodic reports that we file with the SEC. If our management team or independent registered public accounting firm were to furnish an adverse report, or if it is determined that we have a material weakness or significant deficiency in our internal control over financial reporting, investors could lose confidence in the accuracy and completeness of our financial reports, the market price of our common stock could decline, and we could be subject to sanctions or investigations by the NYSE, the SEC or other regulatory authorities or shareholder litigation.

Anti-takeover provisions in our amended and restated certificate of incorporation and amended and restated bylaws could discourage, delay or prevent a change of control of our company and may affect the trading price of our common stock.

Our amended and restated certificate of incorporation and our amended and restated bylaws (the “amended and restated bylaws”) include a number of provisions that may discourage, delay or prevent a change in our management or control over us that stockholders may consider favorable. For example, our amended and restated certificate of incorporation and amended and restated bylaws collectively:

authorize the issuance of “blank check” preferred stock that could be issued by our board of directors to thwart a takeover attempt;
provide for a classified board of directors, which divides our board of directors into three classes, with members of each class serving staggered three-year terms, which prevents stockholders from electing an entirely new board of directors at an annual meeting;
limit the ability of stockholders to remove directors if Providence ceases to beneficially own at least 40% of the outstanding shares of our common stock;
provide that vacancies on our board of directors, including vacancies resulting from an enlargement of our board of directors, may be filled only by a majority vote of directors then in office;
prohibit stockholders from calling special meetings of stockholders if Providence ceases to beneficially own at least 40% of the outstanding shares of our common stock;
prohibit stockholder action by written consent, thereby requiring all actions to be taken at a meeting of the stockholders, if Providence ceases to beneficially own at least 40% of the outstanding shares of our common stock;

43

Table of Contents

establish advance notice requirements for nominations of candidates for election as directors or to bring other business before an annual meeting of our stockholders; and
require the approval of holders of at least 6623% in voting power of the outstanding shares of our capital stock to amend our amended and restated bylaws and certain provisions of our amended and restated certificate of incorporation if Providence ceases to beneficially own at least 40% of the outstanding shares of our common stock.

These provisions may prevent our stockholders from receiving the benefit from any premium to the market price of our common stock offered by a bidder in a takeover context. Even in the absence of a takeover attempt, the existence of these provisions may adversely affect the prevailing market price of our common stock if the provisions are viewed as discouraging takeover attempts in the future.

Our amended and restated certificate of incorporation and amended and restated bylaws may also make it difficult for stockholders to replace or remove our management. Furthermore, the existence of the foregoing provisions, as well as the significant amount of common stock that Providence owns, may facilitate management entrenchment that may delay, deter, render more difficult or prevent a change in our control, which may not be in the best interests of our stockholders.

We could be the subject of securities class action litigation due to future stock price volatility, which could divert management’s attention and materially and adversely affect our business, financial condition, results of operations or cash flows.

The stock market in general, and market prices for the securities of companies like ours in particular, have from time to time experienced volatility that often has been unrelated to the operating performance of the underlying companies. A certain degree of stock price volatility can be attributed to being a newly public company. These broad market and industry fluctuations may adversely affect the market price of our common stock, regardless of our operating performance. In certain situations in which the market price of a stock has been volatile, holders of that stock have instituted securities class action litigation against the company that issued the stock. If any of our stockholders were to bring a similar lawsuit against us, the defense and disposition of the lawsuit could be costly and divert the time and attention of our management and could materially and adversely affect our business, financial condition, results of operations or cash flows.

We do not intend to pay dividends on our common stock for the foreseeable future and, consequently, your ability to achieve a return on your investment depends on appreciation in the price of our common stock.

We do not intend to declare and pay dividends on our common stock for the foreseeable future. We currently intend to use our future earnings, if any, to fund our growth, including through acquisitions, and for working capital needs and general corporate purposes. Therefore, you are not likely to receive any dividends on your common stock for the foreseeable future, and the success of an investment in shares of our common stock depends upon any future appreciation in their value. There is no guarantee that shares of our common stock will appreciate in value or even maintain the price at which our stockholders have purchased their shares. Payments of dividends, if any, are at the sole discretion of our board of directors after taking into account various factors, including general and economic conditions, our financial condition and operating results, our available cash and current and anticipated cash needs, capital requirements, contractual, legal, tax and regulatory restrictions and implications of the payment of dividends by us to our stockholders or by our subsidiaries to us, and such other factors as our board of directors may deem relevant. In addition, our operations are conducted almost entirely through our subsidiaries. As such, to the extent that we determine in the future to pay dividends on our common stock, we will rely on our subsidiaries to make funds available to us for the payment of dividends. Further, the New Revolving Credit Facility limits the ability of our subsidiaries to pay dividends or otherwise transfer assets to us. In addition, Delaware law imposes additional requirements that may restrict our ability to pay dividends to holders of our common stock.

44

Table of Contents

Our amended and restated certificate of incorporation designates the Court of Chancery of the State of Delaware as the sole and exclusive forum for certain litigation that may be initiated by our stockholders, which could limit our stockholders’ ability to obtain a favorable judicial forum for disputes with us or our directors, officers or stockholders.

Our amended and restated certificate of incorporation provides that, unless we consent in writing to the selection of an alternative forum, the Court of Chancery of the State of Delaware will, to the fullest extent permitted by law, be the sole and exclusive forum for (i) any derivative action or proceeding brought on our behalf, (ii) any action or proceeding asserting a claim of breach of a fiduciary duty owed to us or our stockholders by any of our current or former directors, officers, other employees, agents or stockholders, (iii) any action or proceeding asserting a claim arising out of or under the Delaware General Corporation Law (the “DGCL”), or as to which the DGCL confers jurisdiction on the Court of Chancery of the State of Delaware (including, without limitation, any action asserting a claim arising out of or pursuant to our amended and restated certificate of incorporation or our amended and restated bylaws) or (iv) any action or proceeding asserting a claim that is governed by the internal affairs doctrine, in each case, subject to such Court of Chancery of the State of Delaware having personal jurisdiction over the indispensable parties named as defendants; provided that, the exclusive forum provision will not apply to any action or proceeding brought to enforce any liability or duty created by the Exchange Act or any other action or proceeding asserting a claim for which the federal courts have exclusive jurisdiction; provided further that, if and only if the Court of Chancery of the State of Delaware dismisses any such action or proceeding for lack of subject matter jurisdiction, such action or proceeding may be brought in another state or federal court sitting in the State of Delaware. Accordingly, the exclusive forum provision does not relieve us of our duties to comply with the federal securities laws and the rules and regulations thereunder, and our stockholders are not deemed to have waived our compliance with these laws, rules and regulations. Unless the Company consents in writing to the selection of an alternative forum, the federal district courts of the United States of America shall be the exclusive forum for the resolution of any claim arising under the Securities Act. By becoming a stockholder in our company, you will be deemed to have notice of and have consented to the provisions of our amended and restated certificate of incorporation related to choice of forum, provided that, if and only if the Court of Chancery of the State of Delaware dismisses any such action for lack of subject matter jurisdiction, such action may be brought in another state or federal court sitting in the State of Delaware. The choice of forum provision in our amended and restated certificate of incorporation may limit our stockholders’ ability to obtain a favorable judicial forum for disputes with us or any of our directors, officers, other employees, agents or stockholders, which may discourage lawsuits with respect to such claims. Alternatively, if a court were to find the choice of forum provision contained in our amended and restated certificate of incorporation to be inapplicable or unenforceable in an action, we may incur additional costs associated with resolving such action in other jurisdictions, which could materially and adversely affect our business, financial condition or results of operations.

Our amended and restated certificate of incorporation includes provisions limiting the personal liability of our directors for breaches of fiduciary duty under the DGCL.

Our amended and restated certificate of incorporation contains provisions eliminating a director’s personal liability to the fullest extent permitted by the DGCL for monetary damages resulting from a breach of fiduciary duty, except in circumstances involving:

any breach of the director’s duty of loyalty;
acts or omissions not in good faith or which involve intentional misconduct or a knowing violation of the law;
under Section 174 of the DGCL (unlawful dividends); or
any transaction from which the director derives an improper personal benefit.

45

Table of Contents

The principal effect of the limitation on liability provision is that a stockholder will be unable to prosecute an action for monetary damages against a director unless the stockholder can demonstrate a basis for liability for which indemnification is not available under the DGCL. These provisions, however, should not limit or eliminate our rights or any stockholder’s rights to seek non-monetary relief, such as an injunction or rescission, in the event of a breach of a director’s fiduciary duty. These provisions do not alter a director’s liability under federal securities laws. The inclusion of this provision in our amended and restated certificate of incorporation may discourage or deter stockholders or management from bringing a lawsuit against directors for a breach of their fiduciary duties, even though such an action, if successful, might otherwise have benefited us and our stockholders.

Item 1B. Unresolved Staff Comments

None.

Item 2. Properties

Our corporate headquarters are located in New York, New York, where we occupy approximately 87,500 square feet under a lease that expires in July 2038. We lease several additional properties and flexible co-working space in North America, Europe, Asia and Australia. We believe that our properties are adequate for our current needs and if we require additional space, we believe that we would be able to obtain such space on commercially reasonable terms.

Item 3. Legal Proceedings

We are not currently a party to any legal proceedings that would, either individually or in the aggregate, have a material adverse effect on our business, financial condition or cash flows. We may, from time to time, be involved in legal proceedings arising in the normal course of business. The outcome of legal proceedings is unpredictable and may have an adverse impact on our business or financial condition.

Item 4. Mine Safety Disclosures

Not applicable.

46

Table of Contents

PART II

Item 5. Market for Registrant’s Common Equity, Related Stockholder Matters and Issuer Purchases of Equity Securities

Holders of Record

Our common stock is listed on the NYSE under the symbol “DV”.

As of February 21, 2023, we had 165,537,166 shares of common stock outstanding and 106 holders of record of our common stock.

Dividend Policy

We do not intend to declare or pay dividends on our common stock for the foreseeable future. We currently intend to use our future earnings, if any, to fund our growth, including for working capital needs, acquisitions and general corporate purposes. Any future determination to pay dividends on our common stock will be subject to the discretion of our board of directors and depend upon various factors, including our results of operations, financial condition, liquidity requirements, capital requirements, level of indebtedness, contractual restrictions imposed by the New Revolving Credit Facility and the agreements governing any indebtedness we or our subsidiaries may incur in the future, restrictions imposed by Delaware law, general business conditions and other factors that our board of directors may deem relevant.

We did not declare or pay any dividends on our common stock in 2022, 2021 or 2020.

Purchases of Equity Securities by the Issuer and Affiliated Purchases

None.

Recent Sales of Unregistered Securities

None.

Use of Proceeds

On April 23, 2021, we completed our IPO in which we sold 9,977 thousand shares of common stock at a public offering price of $27.00 per share, which includes the full exercise of the underwriters’ option to purchase 1,350 thousand additional shares from us. We received aggregate net proceeds of $253.2 million from the IPO, after deducting underwriting discount fees of $16.2 million. We incurred offering costs related to the IPO of approximately $26.1 million, inclusive of underwriting discount fees. All of the shares issued and sold in our IPO were registered under the Securities Act pursuant to a registration statement on Form S-1 (File No. 333-254380), which was declared effective by the SEC on April 20, 2021. The representatives of the underwriters of our IPO were Goldman Sachs & Co. LLC and J.P. Morgan Securities LLC.

In connection with the IPO, Providence and certain of our other existing stockholders sold an aggregate of 5,356 thousand shares of our common stock, which includes the full exercise of the underwriters’ option to purchase 650 thousand additional shares of our common stock from Providence. We did not receive any proceeds from the sale of shares by these stockholders.

On April 23, 2021, concurrent with the completion of the IPO, an affiliate of Tiger Global Management, LLC (“Tiger Investor”) purchased from us 1,111 thousand shares of our common stock in a private placement at a price per share equal to the IPO price of $27.00. We received aggregate net proceeds of $29.0 million from the concurrent private placement, after deducting fees of $1.0 million.

47

Table of Contents

On April 30, 2021, we used a portion of the net proceeds from the IPO and concurrent private placement to pay the entire outstanding balance under the New Revolving Credit Facility of $22.0 million.

On August 31, 2021, we used a portion of the net proceeds from the IPO and concurrent private placement to purchase all of the outstanding stock of Meetrics for $24.3 million.

On November 22, 2021, we used a portion of the net proceeds from the IPO and concurrent private placement to purchase all of the outstanding stock of OpenSlate for $147.4 million, which included net cash of $124.9 million and common stock transferred of $22.5 million.

There has been no material change in the planned use of the IPO net proceeds as described in our final prospectus, dated April 20, 2021 and filed with the SEC, pursuant to Rule 424(b)(4) under the Securities Act, on April 22, 2021 (the “Prospectus”).

Stock Performance Graph

The following graph compares the cumulative total stockholder return on an initial investment of $100 in our common stock between April 21, 2021, and December 31, 2022, with the comparative cumulative total returns of the Standard & Poor’s (“S&P”) 500 Index, Nasdaq Composite Index and Russell 3000 Index over the same period. We have not paid any cash dividends: therefore, the cumulative total return calculation for us is based solely upon stock price appreciation and not the reinvestment of cash dividends. However, the data for the S&P 500 Index, Nasdaq Composite Index and Russell 3000 Index assumes reinvestments of dividends. The graph assumes the closing market price on April 21, 2021, of $36.00 per share as the initial value of our common stock. The returns shown are based on historical results and are not indicative of, nor intended to forecast, future stock price performance.

Graphic

Item 6. [Reserved]

48

Table of Contents

Item 7. Management’s Discussion and Analysis of Financial Condition and Results of Operations

You should read the following discussion and analysis of our financial condition and results of operations together with our consolidated financial statements and the related notes appearing elsewhere within this Annual Report on Form 10-K. Some of the information contained in this discussion and analysis or set forth elsewhere in this Annual Report on Form 10-K, including information with respect to our plans and strategy for our business, includes forward-looking statements that involve risks, uncertainties and assumptions. You should read the “Special Note Regarding Forward- Looking Statements” and “Risk Factors” sections of this Annual Report on Form 10-K for a discussion of important factors that could cause actual results to differ materially from the results described in or implied by the forward-looking statements contained in the following discussion and analysis.

The following generally discusses 2022 and 2021 items and year-to-year comparisons between 2022 and 2021. Discussion of historical items and year-to-year comparisons between 2021 and 2020 that are not included in this discussion can be found in “Management’s Discussion and Analysis of Financial Condition and Results of Operations” of our Annual Report on Form 10-K for the year ended December 31, 2021. References to “Notes” are notes included in our consolidated financial statements appearing elsewhere in this Annual Report on Form 10-K.

Company Overview

We are a leading software platform for digital media measurement and analytics. Our mission is to create stronger, safer, more secure digital transactions that drive optimal outcomes for global advertisers. Through our software platform and the metrics it provides, we help preserve the fair value exchange between buyers and sellers of digital media.

Our customers include many of the largest global advertisers and digital ad platforms and publishers. We deliver our suite of solutions through a robust and scalable software platform that provides our customers with unified data analytics. We provide a consistent, cross-platform measurement standard across all major forms of digital media, making it easier for advertiser and supply-side customers to benchmark performance across all of their digital ads and to optimize business outcomes in real time. Our coverage spans nearly 100 countries where our customers activate our services and covers all key digital media channels, formats and devices.

Our company was founded in 2008 and introduced our first brand safety and suitability solution in 2010. We launched our first viewability and fraud solutions in 2013 and 2014, respectively. As the global digital advertising market has evolved, we have continued to expand our measurement capabilities and market coverage through new product innovation, increasing our international footprint and new platform partnerships. We announced our first social media platform partnership in 2017 and launched our CTV certification program in 2020.

We have experienced rapid growth and achieved significant profitability in recent years as evidenced by the following:

We generated revenue of $452.4 million for the year ended December 31, 2022 and $332.7 million for the year ended December 31, 2021, representing an increase of 36%.
Our net income was $43.3 million for the year ended December 31, 2022 and $29.3 million for the year ended December 31, 2021.
Our Adjusted EBITDA was $141.6 million for the year ended December 31, 2022 and $109.7 million for the year ended December 31, 2021. Adjusted EBITDA is a non-GAAP financial measure. For information on how we compute Adjusted EBITDA and a reconciliation of Adjusted EBITDA to net income, see “Results of Operations — Adjusted EBITDA.”

For the years ended December 31, 2022 and December 31, 2021, we generated 90% and 91% of our revenue, respectively, from advertiser customers. We derive revenue from our advertising customers based on the volume of Media Transactions Measured on our software platform. Advertisers utilize the DV Authentic Ad, our definitive metric of digital media quality, to evaluate the existence of fraud, brand suitability, viewability and geography for each digital ad. Advertisers pay us a Measured Transaction Fee per thousand impressions based on the volume of Media Transactions Measured on their behalf.

49

Table of Contents

We maintain an expansive set of direct integrations across the entire digital advertising ecosystem, including with leading programmatic and social platforms, which enables us to deliver our metrics across platforms where our customers buy ads. Further, our services are not reliant on any single source of impressions and we can service our customers as their digital advertising needs change. In 2022, we estimate that approximately 55% and 45% of Media Transactions Measured were for display and for video ad formats, respectively. In 2021, approximately 59% and 41% of Media Transactions Measured were for display and for video ad formats, respectively. In 2022, approximately 76%, 20% and 4% of Media Transactions Measured were for mobile devices, desktop devices, and emerging digital channels, respectively. In 2021, approximately 72%, 25% and 3% of Media Transactions Measured were for mobile devices, desktop devices, and emerging digital channels, respectively. For the years ended December 31, 2022 and December 31, 2021, 10% and 9% of our revenue, respectively, was generated from our supply-side customers to validate the quality of their ad inventory. We generate revenue from supply-side customers based on monthly or annual contracts with minimum guarantees and tiered pricing when guarantees are met.

We believe that there are meaningful long-term growth opportunities within the digital advertising market. We plan to continue to invest in the development of new and premium solutions that increase our value proposition to customers and to extend our solutions capabilities to cover new and growing digital media environments, channels and devices, including CTV, new mobile apps and other emerging areas of digital ad spend. We plan to continue to invest in sales and marketing to grow our existing customer relationships and acquire new customers. In addition, we have completed five acquisitions since 2018 and maintain an active pipeline of potential M&A targets and intend to continue evaluating add-on opportunities to bolster our current solutions suite and complement our organic growth initiatives.

Furthermore, we believe that there are significant long-term growth opportunities in markets outside of North America. We expect to continue to make investments in product development, sales and marketing, information technology, financial and administrative systems and controls to support our global growth.

Factors Affecting Our Performance

There are a number of factors that have impacted, and we believe will continue to impact, our results of operations and growth. These factors include:

Significant Growth in Digital Ad Spend. Magna Global estimated that global digital ad spend, excluding search, reached over $253 billion in 2022 and is expected to grow to $352 billion by 2027. Our revenues have grown substantially as a result of the growth in digital advertising as well as the continued adoption of digital measurement solutions and analytics. As the digital advertising market has grown, advertisers have increasingly shifted their digital media spend to both programmatic and social media channels in order to directly target advertisements to achieve desired business outcomes. We have been direct beneficiaries of this growth by virtue of our integrations with leading programmatic and social media platforms. In the year ended December 31, 2022, the revenue we generated by providing our activation solutions through programmatic and social integrations and our measurement solutions through social integrations grew 50% and 28%, respectively, over the prior year period. In the year ended December 31, 2021, the revenue we generated by providing our activation solutions through programmatic and social integrations and our measurement solutions through social integrations grew 45% and 47%, respectively, over the prior year period.

50

Table of Contents

Growth of Existing Customers. Our customers include many of the largest digital advertisers in the world and we have maintained exceptional customer retention with gross revenue retention rates of over 95% in each of the years ended December 31, 2022 and 2021. We define our gross revenue retention rate as the total prior year revenue earned from advertiser customers, less the portion of prior year revenue attributable to lost advertiser customers, divided by the total prior year revenue from advertiser customers, excluding a portion of our revenues that cannot be allocated to specific advertiser customers. Gross retention rates demonstrate strength in underlying business, recurring business profile, level of client satisfaction and lack of churn. We expect to continue to grow with our existing customers as they increase their spend on digital advertising and as we introduce new solutions across key channels, formats, devices and geographies. We have generated strong historical net revenue retention rates, with 127% for the year ended December 31, 2022 and 126% for the year ended December 31, 2021. We define our net revenue retention rate as the total current period revenue earned from advertiser customers, which were also customers during the entire most recent twelve-month period, divided by the total prior year period revenue earned from the same advertiser customers, excluding a portion of our revenues that cannot be allocated to specific advertiser customers. Net retention rates demonstrate strength in underlying business, recurring business profile, level of client satisfaction and lack of churn. Limitations for these metrics include limiting their usefulness as a comparative measure and the metrics not being the best indicator of our cash flows or future operating results. You should compensate for these limitations by relying primarily on the Company’s GAAP results and using the non-GAAP financial measures only supplementally.

Year Ended December 31, 


2022


2021

Advertiser revenue retention:


Gross revenue retention

> 95%

> 95%

Net revenue retention


127%


126%

New Solutions and Channels. We have a strong track record of developing new solutions that have high adoption rates with our existing customers. We intend to extend our solutions capabilities to new adjacencies and cover new and growing digital channels and devices, including CTV, new mobile apps and other emerging areas of digital ad spend. At the end of 2018, we launched our Authentic Brand Suitability solution that allows advertisers to create a centralized set of brand suitability controls that can be automatically deployed across multiple programmatic buying platforms and campaigns. Authentic Brand Suitability, which significantly reduces wasted ad spend, generated $123.3 million and $84.6 million of revenue in 2022 and 2021, respectively. In 2022, we developed and launched several new solutions: (i) Fully On-Screen targeting, which empowers programmatic CTV advertisers to target inventory from sources that have received DV’s Fully On-Screen Certification, (ii) the DV Authentic Attention Snapshot, a comprehensive overview of high-level attention measurement made available to all DV advertisers, (iii) sustainability measurement, powered by Scope3, to provide advertisers with a comprehensive campaign-based carbon footprint via DV’s analytics platform, DV Pinnacle, and (iv) Post-campaign Brand Safety and Suitability measurement on TikTok, enabling advertisers to leverage a consistent measurement standard across all major platforms and publishers in order to inform future media planning and buying decisions.

New Geographies. Our customer base is predominately U.S.-based today. We intend to grow our presence in international markets in order to meet the needs of our existing customers and accelerate new customer acquisition in key geographies outside of North America. With offices or commercial operations in 21 locations across 17 countries, our expansion to new geographies has helped us to win the international business of our existing customers and to establish relationships with some of the world’s largest international advertisers. As of December 31, 2022, 348 of our 902 employees were based outside of the Americas.

51

Table of Contents

COVID-19. Although COVID-19 related restrictions have eased across the world, there remains uncertainty around the pandemic and its effect on macroeconomic factors, including supply-chains. Throughout the pandemic, we have continued to experience revenue growth over the prior year and the primary impact of the pandemic on our business has been a moderation of our revenue growth in 2020 as compared to 2019. The underlying demand for our products has remained relatively unchanged, with limited disruption on our new customer sales. To date, we have not experienced a material increase in customers’ cancellations, or requests for more favorable contractual terms, or concessions. We have also not experienced a significant deterioration in the collectability of our receivables or a material negative impact from our vendors and third-party service providers.

For the year ended December 31, 2022, we generated growth of 36% in total revenue as compared to the year ended December 31, 2021. Our ability to grow revenue within our existing customer accounts has remained strong, with a net revenue retention of 127% for the year ended December 31, 2022 and 126% for the year ended December 31, 2021. Our existing customer base has remained largely stable, and our gross revenue retention rate was over 95% for each of the years ended December 31, 2022 and 2021. Additionally, we generated net cash provided by operating activities of $94.9 million and $82.7 million in those same periods, respectively. We have had ample liquidity and capital resources to continue to meet our operating needs, and our ability to continue to service our debt or other financial obligations is not currently impaired.

While the impact of the pandemic on our business has been limited to date, our revenues are dependent on advertiser demand. The pandemic has resulted in market and supply chain disruptions and a global economic slowdown, which has materially impacted demand for a broad variety of goods and services, and is also disrupting sales channels and marketing activities. To the extent that demand for digital advertising declines, our results of operations and financial condition may be materially impacted. The duration of such disruptions is highly uncertain and cannot be predicted. See “Risk Factors — Risks Relating to Our Business — Economic downturns and unstable market conditions could adversely affect our business, financial condition and results of operations.”

Russia’s Invasion of Ukraine. In February 2022, the Russian Federation commenced a military action in Ukraine. In response to the military action, and in support of the people of Ukraine, we voluntarily discontinued our relationships with Russia-based customers. As the situation continues to evolve, we are closely monitoring the current and potential impact on our business, our people and our customers. The impact on our business is not material, but, as a result of the discontinuation of services with Russia-based advertisers and the ongoing conflict in Ukraine, the Company had a $1.0 million increase in bad debt reserves during the year ended December 31, 2022.

While the factors above may present significant opportunities for us, they also pose significant risks and challenges. See “Risk Factors” for more information on risks and uncertainties that may impact our business and financial results.

Components of Our Results of Operations

We manage our business operations and report our financial results in a single segment.

Revenue

Our customers use our solutions to measure their digital advertisements. We generate revenue from our advertising customers based on the volume of Media Transactions Measured on our software platform and from supply-side customers based on contracts with minimum guarantees or contracts that have tiered pricing after minimum guarantees are achieved.

52

Table of Contents

For the years ended December 31, 2022 and 2021, we generated 90% and 91% of our revenue, respectively, from advertiser customers. Advertisers can purchase our services to measure the quality and performance of ads purchased directly from digital properties, including publishers and social media platforms, which we track as Measurement (f/k/a Advertiser – direct) revenue. Advertisers can also purchase our services through programmatic platforms to evaluate the quality of ad inventories before they are purchased, which we track as Activation (f/k/a Advertiser – programmatic) revenue. We generate revenue from advertisers by charging a Measured Transaction Fee based on the volume of Media Transactions Measured on behalf of our customers. We recognize revenue from advertisers in the period in which we provide our measurement solutions. Advertisers typically leverage the full suite of our proprietary DV Authentic Ad metric to evaluate and measure the existence of fraud, brand suitability, viewability and geography for their digital ad investments. We have long-term relationships with many of our customers, with an average relationship of over seven years for our top 75 customers and over eight years for both our top 50 and 25 customers, and ongoing contractual agreements with a substantial portion of our customer base.

For the years ended December 31, 2022 and 2021, we generated 10% and 9% of our revenue, respectively, from supply-side customers who use our data analytics to validate the quality of their ad inventory and provide data to their customers to facilitate targeting and purchasing digital ads. We generate revenue for certain supply-side arrangements that include minimum guaranteed fees that reset monthly and are recognized on a straight-line basis over the access period, which is usually 12 months. For contracts that contain overages, once the minimum guaranteed amount is achieved, overages are recognized as earned over time based on a tiered pricing structure.

Year Ended December 31, 

Change

Change

2022


2021

$


%

(In Thousands)

Revenue by customer type:


Measurement (f/k/a Advertiser - direct)

$

157,908

$

135,516

$

22,392

17

%

Activation (f/k/a Advertiser - programmatic)


251,198


167,798

83,400

50

Supply-side customer


43,312


29,427

13,885

47

Total revenue

$

452,418

$

332,741

$

119,677

36

%

See “Critical Accounting Policies and Estimates — Revenue Recognition” for a description of our revenue recognition policies.

Operating Expenses

Our operating expenses consist of the following categories:

Cost of revenue. Cost of revenue primarily consists of platform hosting fees, data center costs, software and other technology expenses, and other costs directly associated with data infrastructure; personnel costs, including salaries, bonuses, stock-based compensation and benefits, directly associated with the support and delivery of our software platform and data solutions; and costs from revenue-sharing arrangements with our partners.

Product development. Product development expenses primarily consist of personnel costs, including salaries, bonuses, stock-based compensation and benefits, third party vendors and outsourced engineering services, and allocated overhead. We allocate overhead such as information technology infrastructure, rent and occupancy charges based on headcount. Product development expenses are expensed as incurred, except to the extent that such costs are associated with software development that qualifies for capitalization, which are then recorded as capitalized software development costs included in Property, plant and equipment, net on our Consolidated Balance Sheets. We amortize capitalized software development costs to depreciation and amortization.

53

Table of Contents

Sales, marketing, and customer support. Sales, marketing, and customer support expenses primarily consist of personnel costs directly associated with our sales, marketing, and customer support departments, including salaries, bonuses, commissions, stock-based compensation and benefits, and allocated overhead. We allocate overhead such as information technology infrastructure, rent and occupancy charges based on headcount. Sales and marketing expense also includes costs for promotional marketing activities, advertising costs, and attendance at events and trade shows. Sales commissions are expensed as incurred.

General and administrative. General and administrative expenses primarily consist of personnel expenses associated with our executive, finance, legal, human resources and other administrative employees. Our general and administrative expenses also include professional fees for external accounting, legal, investor relations and other consulting services, and other overhead, as well as third-party costs related to acquisitions.

As part of our transition to becoming a public company in 2021, we incurred certain non-recurring professional fees and other expenses. Further, we have incurred, and will continue to incur, additional expenses as a result of operating as a public company, including costs to comply with rules and regulations applicable to companies listed on a U.S. securities exchange, costs related to compliance and reporting obligations pursuant to the rules and regulations of the SEC and other professional services.

Interest expense. Interest expense for the years ended December 31, 2022 and 2021, consists primarily of debt issuance costs, interest on outstanding balances under the New Revolving Credit Facility and interest on finance leases. On October 1, 2020, the Company entered into the New Revolving Credit Facility and repaid all amounts outstanding under the Prior Credit Facilities (as defined herein). The New Revolving Credit Facility bears interest at LIBOR plus an applicable margin per annum. On April 30, 2021, the Company used a portion of the net proceeds from the IPO and the concurrent private placement to pay the entire outstanding balance of $22.0 million under the New Revolving Credit Facility. See Note 9 to our audited consolidated financial statements included elsewhere in this Annual Report on Form 10-K.

Other (income) expense. Other (income) expense consists primarily of interest earned on our cash equivalents and short-term investments, gains and losses on foreign currency transactions, and change in fair value associated with contingent consideration related to our acquisitions.

Results of Operations

Comparison of the Years Ended December 31, 2022 and 2021

The following tables show our results of operations for the years ended December 31, 2022 and 2021:

Year Ended


December 31,

Change

Change


2022


2021


$


%  

(In Thousands)

Revenue

$

452,418


$

332,741

$

119,677

36

%

Cost of revenue (exclusive of depreciation and amortization shown separately below)


77,866


54,382


23,484

43

Product development


95,118


62,698


32,420

52

Sales, marketing and customer support


107,416


77,312


30,104

39

General and administrative


78,666


81,380


(2,714)

(3)

Depreciation and amortization


34,328


30,285


4,043

13

Income from operations


59,024


26,684


32,340

121

Interest expense


905


1,172


(267)

(23)

Other income, net


(1,249)


(309)


(940)

304

Income before income taxes


59,368


25,821


33,547

130

Income tax expense (benefit)


16,100


(3,487)


19,587

562

Net income

$

43,268

$

29,308

$

13,960

48

%

54

Table of Contents

Year Ended

December 31,


2022


2021


(as % of Revenue)

Revenue


100

%  

100

%

Cost of revenue (exclusive of depreciation and amortization shown separately below)


17


16

Product development


21


19

Sales, marketing and customer support


24


23

General and administrative


17


24

Depreciation and amortization


8


9

Income from operations


13


8

Interest expense


Other income, net


Income before income taxes


13


8

Income tax expense (benefit)


4


(1)

Net income


10

%  

9

%

Revenue

Total revenue increased by $119.7 million, or 36%, from $332.7 million in the year ended December 31, 2021 to $452.4 million in the year ended December 31, 2022. We delivered a 22% increase in Media Transactions Measured and a 7% increase in Measured Transaction Fees. Advertiser net revenue retention rate was 127% for the year ended December 31, 2022, and 126% for the year ended December 31, 2021.

Activation (f/k/a Advertiser – programmatic) revenue increased $83.4 million, or 50%, driven by greater adoption of our Authentic Brand Suitability (ABS) solution as well as by new customers activating our core (non-ABS) programmatic solutions. Revenue from OpenSlate’s pre-campaign social activation tools and the implementation of pricing tiers based on enhanced programmatic integrations also contributed to year over year growth.

Measurement (f/k/a Advertiser – direct) revenue increased $22.4 million, or 17%, primarily driven by new customers and expansions by existing customers, both within and outside the United States. Revenue from social media platforms represented 37% and 33% of total Measurement revenue in 2022 and 2021, respectively.

Supply-side revenue increased $13.9 million, or 47%, primarily driven by an increase in revenue from existing and new platform customers, and by the integration of OpenSlate solutions into our product suite.

Cost of Revenue (exclusive of depreciation and amortization shown below)

Cost of revenue increased by $23.5 million, or 43%, from $54.4 million in the year ended December 31, 2021 to $77.9 million in the year ended December 31, 2022. The increase was primarily due to growth in Activation (f/k/a Advertiser – programmatic) revenue which drove increases in partner costs from revenue-sharing arrangements, as well as accelerated investments in cloud services to provide scale and flexibility necessary to support future growth.

Product Development Expenses

Product development expenses increased by $32.4 million, or 52%, from $62.7 million in the year ended December 31, 2021 to $95.1 million in the year ended December 31, 2022. The increase was primarily due to an increase in personnel costs, including stock-based compensation, of $23.9 million, an increase in third party software costs and outsourced engineering services of $4.4 million to support our product development efforts, and an increase in allocated rent expense of $2.5 million.

55

Table of Contents

Sales, Marketing and Customer Support Expenses

Sales, marketing and customer support expenses increased by $30.1 million, or 39%, from $77.3 million in the year ended December 31, 2021 to $107.4 million in the year ended December 31, 2022. The increase was primarily due to an increase in personnel costs, including stock-based compensation and sales commissions, of $23.5 million to support sales and account management efforts globally, and drive continued expansion with existing and new customers. Marketing activities, including advertising, promotions, events and other activities increased $1.1 million, personnel travel and entertainment expenses to support marketing and sales activities increased $2.2 million, and allocated rent expense increased $2.2 million.

General and Administrative Expenses

General and administrative expenses decreased by $2.7 million, or 3%, from $81.4 million in the year ended December 31, 2021 to $78.7 million in the year ended December 31, 2022. Personnel costs, including stock-based compensation, increased $6.2 million. Non-personnel cost increases included $5.7 million in bad debt reserves, $3.0 million in professional fees, $2.3 million in insurance costs for coverage as a public company, and $1.3 million in rent expense. Cost increases were more than offset by a $22.3 million decrease in costs related to the 2021 preparation and completion of the Company’s IPO.

Depreciation and Amortization

Depreciation and amortization increased by $4.0 million, or 13%, from $30.3 million in the year ended December 31, 2021 to $34.3 million in the year ended December 31, 2022. The increase was primarily due to an increase in intangibles related to the acquisition of OpenSlate and an increase in leasehold improvements at the Company’s new global headquarters, partially offset by write-offs and fully depreciated fixed assets.

Interest Expense

Interest expense is mainly related to costs for the New Revolving Credit Facility, which carries a variable interest rate, and to finance leases. Interest expense decreased by $0.3 million, from $1.2 million in the year ended December 31, 2021, to $0.9 million in the year ended December 31, 2022. The decrease was attributable to a reduction in outstanding debt and a reduction in interest costs related to finance leases. As of December 31, 2022 and 2021, the Company held no debt.

Other Income, Net

Other income increased by $0.9 million, from $0.3 million in the year ended December 31, 2021, to $1.2 million in the year ended December 31, 2022. The increase was primarily due to a $2.3 million increase in interest income earned on monetary assets, partially offset by losses related to changes in foreign currency exchange rates.

Income Tax Expense (Benefit)

Income tax expense increased by $19.6 million from a benefit of $3.5 million in the year ended December 31, 2021 to an expense of $16.1 million in the year ended December 31, 2022. The increase was primarily due to an increase in pre-tax book income and permanent book-to-tax income adjustments primarily related to non-cash compensation.

56

Table of Contents

Adjusted EBITDA

In addition to results determined in accordance with GAAP, we believe that certain non-GAAP financial measures, including Adjusted EBITDA and Adjusted EBITDA Margin, are useful in evaluating our business. We calculate Adjusted EBITDA Margin as Adjusted EBITDA divided by total revenue. The following table presents a reconciliation of Adjusted EBITDA, a non-GAAP financial measure, to the most directly comparable financial measure prepared in accordance with GAAP.

Year Ended December 31, 

2022


2021

(In Thousands)

Net income

$

43,268

$

29,308

Net income margin


10%


9%

Depreciation and amortization


34,328


30,285

Stock-based compensation


42,307


21,887

Interest expense


905


1,172

Income tax expense (benefit)


16,100


(3,487)

M&A and restructuring costs (a)


1,224


3,510

Offering, IPO readiness and secondary offering costs (b)


1,292


23,564

Other costs (c)


3,414


3,812

Other income (d)


(1,249)


(309)

Adjusted EBITDA

$

141,589

$

109,742

Adjusted EBITDA margin


31%


33%

(a)M&A and restructuring costs for the year ended December 31, 2022 consist of transaction costs, integration and restructuring costs related to the acquisition of OpenSlate. M&A costs for the year ended December 31, 2021 consist of transaction and integration costs related to the acquisition of Meetrics and OpenSlate as well as associated restructuring costs and related activities.
(b)Offering, IPO readiness and secondary offering costs for the year ended December 31, 2022 consist of third-party costs incurred for the Company’s filing of a “shelf” registration statement on Form S-3, and costs incurred for an underwritten secondary public offering by certain stockholders of the Company.  Offering, IPO readiness and secondary offering costs for the year ended December 31, 2021 consist of third-party costs incurred for the Company’s IPO, and costs for an underwritten secondary public offering by certain stockholders of the Company.
(c)Other costs for the year ended December 31, 2022 consist of costs related to the departures of the Company’s former Chief Operating Officer and Chief Customer Officer, impairment related to a subleased office space and costs related to the disposal of furniture for unoccupied lease office space, partially offset by sublease income for lease office space. Other costs for the year ended December 31, 2021 include reimbursements paid to Providence for costs incurred prior to the IPO date, non-recurring recognition of a cease-use liability related to unoccupied lease office space, and costs associated with the early termination of the agreement for the Zentrick Deferred Payment Terms, previously disclosed as a contingency.
(d)Other income for the years ended December 31, 2022 and 2021 consists of interest income earned on monetary assets, changes in fair value associated with contingent consideration, and the impact of changes in foreign currency exchange rates.

We use Adjusted EBITDA and Adjusted EBITDA Margin as measures of operational efficiency to understand and evaluate the core business operations of the Company. We believe that these non-GAAP financial measures are useful to investors for period to period comparisons of the core business and for understanding and evaluating trends in operating results on a consistent basis by excluding items that we do not believe are indicative of the core operating performance of the Company.

57

Table of Contents

These non-GAAP financial measures have limitations as analytical tools and should not be considered in isolation or as substitutes for an analysis of the Company’s results as reported under GAAP. Some of the limitations of these measures are:

they do not reflect changes in, or cash requirements for, working capital needs;
Adjusted EBITDA does not reflect capital expenditures or future requirements for capital expenditures or contractual commitments;
they do not reflect income tax expense or the cash requirements to pay income taxes;
they do not reflect interest expense or the cash requirements necessary to service interest or principal payments on debt; and
although depreciation and amortization are non-cash charges related mainly to intangible assets, certain assets being depreciated and amortized will have to be replaced in the future, and Adjusted EBITDA does not reflect any cash requirements for such replacements.

In addition, other companies in the industry may calculate these non-GAAP financial measures differently, therefore limiting their usefulness as a comparative measure. You should compensate for these limitations by relying primarily on the Company’s GAAP results and using the non-GAAP financial measures only supplementally.

Selected Quarterly Results of Operations

The following tables set forth our unaudited consolidated quarterly results of operations for each of the 8 quarters within the period from January 1, 2021 to December 31, 2022. Our quarterly results of operations have been prepared on the same basis as our consolidated financial statements, and we believe they reflect all normal recurring adjustments necessary for the fair presentation of our results of operations for these periods. This information should be read in conjunction with our consolidated financial statements and related notes included elsewhere in this Annual Report on Form 10-K. These quarterly results of operations are not necessarily indicative of our results of operations for a full year or any future period.

We experience fluctuations in revenue that coincide with seasonal fluctuations in the digital ad spending of our customers. Advertisers typically allocate the largest portion of their media budgets to the fourth quarter of the calendar year in order to coincide with increased holiday purchasing. As a result, the fourth quarter of the year typically reflects our highest level of measurement of digital ads while the first quarter reflects the lowest level of such activity. We expect our revenue to continue to fluctuate based on seasonal factors that affect the advertising industry as a whole. While our revenue is highly recurring, seasonal fluctuations in ad spend may impact quarter-over-quarter results. We believe that the year-over- year comparison of results more appropriately reflects the overall performance of the business.

58

Table of Contents

Three Months Ended

Dec 31,

Sep 30,

Jun 30,

Mar 31,

Dec 31,

Sep 30,

Jun 30,

Mar 31,


2022


2022


2022


2022


2021


2021


2021


2021

(In Thousands)

Revenue

$

133,636


$

112,254


$

109,805


$

96,723


$

105,533


$

83,098


$

76,524


$

67,586

Cost of revenue (exclusive of depreciation and amortization shown separately below)


22,830


19,323


18,836


16,877


18,453


13,435


12,291


10,203

Product development


26,376


23,932


23,222


21,588


17,040


16,359


15,120


14,179

Sales, marketing and customer support


28,881


27,118


24,733


26,684


22,659


19,539


19,580


15,534

General and administrative


18,067


19,395


21,529


19,675


23,063


14,465


32,017


11,835

Depreciation and amortization


8,882


8,089


8,317


9,040


8,296


7,492


7,440


7,057

Income (loss) from operations


28,600


14,397


13,168


2,859


16,022


11,808


(9,924)


8,778

Interest expense


224


226


223


232


236


249


297


390

Other (income) expense, net


(1,671)


231


145


46


(674)


365


49


(49)

Income (loss) before income taxes


30,047


13,940


12,800


2,581


16,460


11,194


(10,270)


8,437

Income tax expense (benefit)


11,979


3,609


2,510


(1,998)


(11,848)


3,270


2,298


2,793

Net income (loss)

$

18,068

$

10,331

$

10,290

$

4,579

$

28,308

$

7,924

$

(12,568)

$

5,644

The following table sets forth our unaudited consolidated results of operations for the specified periods as a percentage of revenue:

Three Months Ended

Dec 31,

Sep 30,

Jun 30,

Mar 31,

Dec 31,

Sep 30,

Jun 30,

Mar 31,


2022


2022

2022

2022

2021

2021

2021

2021

(as % of Revenue)

Revenue


100

%  

100

%

100

%

100

%

100

%

100

%

100

%

100

%

Cost of revenue (exclusive of depreciation and amortization shown separately below)


17


17

17

17

17

16

16

15

Product development


20


21

21

22

16

20

20

21

Sales, marketing and customer support


22


24

23

28

21

24

26

23

General and administrative


14


17

20

20

22

17

42

18

Depreciation and amortization


7


7

8

9

8

9

10

10

Income (loss) from operations


21


13

12

3

15

14

(13)

13

Interest expense


1

Other (income) expense, net


(1)


(1)

Income (loss) before income taxes


22


12

12

3

16

13

(13)

12

Income tax expense (benefit)


9


3

2

(2)

(11)

4

3

4

Net income (loss)


14

%  

9

%

9

%

5

%

27

%

10

%

(16)

%

8

%

59

Table of Contents

The following table presents a reconciliation of Adjusted EBITDA, a non-GAAP financial measure, to the most directly comparable financial measure prepared in accordance with GAAP.

Three Months Ended

Dec 31,

Sep 30,

Jun 30,

Mar 31,

Dec 31,

Sep 30,

Jun 30,

Mar 31,

2022


2022


2022


2022


2021


2021


2021


2021

(In Thousands)

Net income

$

18,068

$

10,331

$

10,290

$

4,579

$

28,308

$

7,924

$

(12,568)

$

5,644

Net income margin


14%


9%


9%


5%


27%


10%


(16%)


8%

Depreciation and amortization


8,882


8,089


8,317


9,040


8,296


7,492


7,440


7,057

Stock-based compensation


11,083


10,971


9,259


10,994


9,787


4,848


4,714


2,538

Interest expense


224


226


223


232


237


249


297


390

Income tax expense (benefit)


11,979


3,609


2,510


(1,998)


(11,848)


3,270


2,298


2,793

M&A and restructuring costs (recoveries)


5


39


527


653


2,382


1,079


67


(18)

Offering, IPO readiness and secondary offering costs


566


726


1,099


318


18,886


3,261

Other (recoveries) costs


(245)


(228)


2,690


1,197


2,825


878


109

Other (income) expense


(1,671)


231


145


46


(674)


365


49


(49)

Adjusted EBITDA

$

48,891

$

33,994

$

33,961

$

24,743

$

40,412

$

26,423

$

21,183

$

21,725

Adjusted EBITDA margin


37%


30%


31%


26%


38%


32%


28%


32%

Liquidity and Capital Resources

The Company’s operations are financed primarily through cash generated from operations. In October 2020, the Company entered into the New Revolving Credit Facility with available borrowings of $150 million. The Company had no outstanding debt under the New Revolving Credit Facility as of December 31, 2022. As of December 31, 2022, the Company had cash of $267.8 million and net working capital, consisting of current assets (excluding cash) less current liabilities, of $108.4 million. As of December 31, 2021, the Company had cash of $221.6 million and net working capital, consisting of current assets (excluding cash) less current liabilities, of $89.2 million.

In 2021, the Company received aggregate net proceeds of $253.2 million from the IPO, after deducting underwriting discount fees of $16.2 million. The Company also received aggregate net proceeds of $28.9 million from the concurrent private placement, after deducting fees of $1.0 million. We believe our existing cash and cash generated from operations, together with the undrawn balance under the New Revolving Credit Facility, will be sufficient to meet the Company’s working capital and capital expenditure requirements on a short-term and long-term basis.

We anticipate that our capital expenditures, including capitalized software, will be approximately $15 million to $25 million for 2023. We anticipate our lease payment obligations, including operating and finance leases, will be approximately $10 million for 2023. Our total future capital requirements and the adequacy of available funds will depend on many factors, including those discussed above as well as the risks and uncertainties set forth under “Risk Factors.”

Debt Obligations

In October 2020, DoubleVerify Inc., as borrower, and DoubleVerify MidCo, Inc., as guarantor, entered into the New Revolving Credit Facility and, in connection therewith, repaid all amounts outstanding under the Prior Credit Facilities.

On December 24, 2020, DoubleVerify Inc. prepaid $68.0 million of the outstanding principal amount under the New Revolving Credit Facility with a portion of the proceeds from the Private Placement (as defined herein). As of December 31, 2020, $22.0 million was outstanding under the New Revolving Credit Facility.

On April 30, 2021, we used a portion of the net proceeds from the IPO and the concurrent private placement to pay the entire outstanding balance of $22.0 million under the New Revolving Credit Facility.

60

Table of Contents

The New Revolving Credit Facility is secured by substantially all of the assets of the Credit Group (subject to customary exceptions) and contain customary affirmative and restrictive covenants, including with respect to our ability to enter into fundamental transactions, incur additional indebtedness, grant liens, pay dividends or make distributions to our stockholders and engage in transactions with our affiliates.

The New Revolving Credit Facility also requires us to remain in compliance with certain financial ratios and is in compliance as of December 31, 2022.

For more information about the Prior Credit Facilities and the New Revolving Credit Facility, see Note 9 to our audited consolidated financial statements included elsewhere in this Annual Report on Form 10-K.

Cash Flows

The following table summarizes our cash flows for the periods indicated:

Year Ended December 31, 


2022


2021

(In Thousands)

Cash flows provided by operating activities

$

94,862

$

82,749

Cash flows (used in) investing activities


(39,981)


(158,614)

Cash flows (used in) provided by financing activities


(7,884)


264,395

Effect of exchange rate changes on cash and cash equivalents and restricted cash


(784)


(200)

Increase in cash, cash equivalents and restricted cash

$

46,213

$

188,330

Operating Activities

For the year ended December 31, 2022, cash provided by operating activities was $94.9 million, attributable to net income of $43.3 million, adjusted for non-cash charges of $72.8 million and net cash outflows of $21.2 million used in changes in operating assets and liabilities. Non-cash charges primarily consisted of $34.3 million in depreciation and amortization, $42.3 million in stock-based compensation, and $7.3 million in non-cash lease expenses, offset by $19.6 million in deferred taxes. The main drivers of the changes in operating assets and liabilities were an increase in trade receivables and prepaid expenses and other assets of $40.7 million due to an increase in sales and the timing of cash receipts, and an increase of $19.5 million in trade payables and accrued expenses and other liabilities. Accrued expenses and other liabilities include the benefit of $8.7 million tenant improvement allowance received from the landlord of the Company’s new global headquarters and income taxes of $10.6 million.

For the year ended December 31, 2021, cash provided by operating activities was $82.7 million, attributable to net income of $29.3 million, adjusted for non-cash charges of $66.9 million and net cash outflows of $13.4 million used in changes in operating assets and liabilities. Non-cash charges primarily consisted of $30.3 million in depreciation and amortization, $22.1 million of offering costs related to the preparation and completion of the Company’s IPO and $21.9 million in stock-based compensation, partially offset by a $7.9 million credit for deferred taxes. The main drivers of the changes in operating assets and liabilities were an increase in trade receivables and prepaid assets of $29.1 million due to an increase in sales and the timing of cash receipts, and an increase of $16.2 million in trade payable and accrued expenses and other liabilities.

Our cash flows from operating activities are primarily influenced by growth in our operations and by changes in our working capital. In particular, accounts receivable increases in conjunction with our rapid growth in sales and decreases based on timing of cash receipts from our customers. The timing of payments on our liabilities also impacts our cash flows from operating activities. We typically pay suppliers in advance of collections from our clients. Our collection and payment cycles can vary from period to period.

61

Table of Contents

We compute our average days sales outstanding, or DSO, as of a given date based on our total trade receivables balance, including unbilled accounts receivable, at the end of the period, divided by the average daily total revenue of the trailing three-month period. This metric is used by us to determine the effectiveness of our credit and collection efforts in allowing credit to customers, as well as our ability to collect. We compute our average days payable outstanding, or DPO, as of a given date based on our trade payables balance at the end of the period, divided by the average daily cost of operating expenses over such period, excluding depreciation, amortization, and certain other costs that are excluded from Adjusted EBITDA. This metric is used by the Company to determine the amount of days it takes to pay its invoices to our trade creditors. Limitations for these metrics include limiting their usefulness as a comparative measure and the metrics not being the best indicator of our cash flows. You should compensate for these limitations by relying primarily on the Company’s GAAP results and using the non-GAAP financial measures only supplementally.

The following table summarizes the DSO and DPO for the periods presented.

As of December 31, 


2022


2021

(ln Days)

DSO


113


105

DPO


54


64

Investing Activities

For the year ended December 31, 2022, cash used in investing activities of $40.0 million was attributable to purchases of property, plant and equipment, including leasehold improvements and furniture and fixtures for the Company’s new global headquarters of approximately $32.4 million, and capitalized software development costs.

For the year ended December 31, 2021, cash used in investing activities of $158.6 million was attributable to the acquisitions of Meetrics and of OpenSlate, purchases of property, plant and equipment, and capitalized software development costs.

Financing Activities

For the year ended December 31, 2022, cash used in financing activities of $7.9 million was primarily due to $10.2 million of shares repurchased for settlement of employee tax withholdings, $3.2 million of contingent consideration related to the acquisition of Zentrick, partially offset by $5.8 million of proceeds from common stock issued upon exercise of stock options.

For the year ended December 31, 2021, cash provided by financing activities of $264.4 million was primarily due to $299.4 million of proceeds from the IPO and concurrent private placement, $12.4 million of proceeds from stock option exercises, partially offset by $22.0 million of debt repayment and $22.1 million of offering costs related to the preparation and completion of the Company’s IPO.

Off-Balance Sheet Arrangements

During the periods presented, we did not have any off-balance sheet arrangements that have or are reasonably likely to have a current or future effect on our financial condition, changes in financial condition, revenues or expenses, results of operations, liquidity, capital expenditures or capital resources that are material to investors.

62

Table of Contents

Critical Accounting Policies and Estimates

Management’s discussion and analysis of our financial condition and results of operations is based on our consolidated financial statements, which have been prepared in accordance with GAAP. The preparation of these consolidated financial statements requires us to make estimates and assumptions for the reported amounts of assets and liabilities and related disclosures at the dates of the financial statements, and revenue and expenses during the reporting periods. Our estimates are based on our historical experience and on various other factors that we believe are reasonable for making judgments about the carrying value of assets and liabilities that are not readily apparent from other sources. We evaluate these estimates on an ongoing basis. Actual results may differ from these estimates under different assumptions or conditions, and any such differences may be material.

While our significant accounting policies are more fully described in Note 2, Basis of Presentation and Summary of Significant Accounting Policies to our audited consolidated financial statements included elsewhere in this Annual Report on Form 10-K, we believe the following discussion addresses our most critical accounting policies, which are those that are most important to our financial condition and results of operations and require our most difficult, subjective and complex judgments.

Revenue Recognition

In accordance with ASC 606, Revenue from Contracts with Customers, the Company recognizes revenue under the core principle to depict the transfer of control to its customers in an amount reflecting the consideration to which it expected to be entitled. In order to achieve that core principle, the Company applies the following five-step approach: (1) identify the contract with a customer, (2) identify the performance obligations in the contract, (3) determine the transaction price, (4) allocate the transaction price to the performance obligations in the contract, and (5) recognize revenue when a performance obligation is satisfied.

For Measurement (f/k/a Advertiser – direct) revenue, our contracts with our customers typically consist of the various ad measurement services that we offer. Included in these services is access to our software platform that allows customers to access and manage their data related to our services. We deliver our services together when media transactions are measured and primarily charge a contractually fixed Measured Transaction Fee per 1,000 impressions on the number of Media Transactions Measured. We recognize revenue over time when we satisfy a performance obligation by transferring promised services to a customer.

For Activation (f/k/a/ Advertiser – programmatic) revenue, our customers can elect to use our services for evaluating the quality of advertising they are considering purchasing. Customers purchase our social activation solutions directly from us, and our programmatic activation solutions through Demand-Side Platforms that manage ad campaign auctions and inventories on their behalf. We enter into product integration agreements with our Demand-Side Platform partners. In these arrangements, the customer pays a Measured Transaction Fee to the Company (collected by the Demand-Side Platform) for the successful execution of the purchase of advertising inventory on an exchange. We recognize revenue over time when we satisfy a performance obligation by transferring promised services to a customer.

For Supply-side revenue, we offer to our supply-side platform partners arrangements to measure all ads on their platform. These arrangements are typically subscription-based with minimum guarantees, and are recognized on a straight-line basis over the term of the contract, usually twelve months. For contracts that contain overages, once the minimum guaranteed amount is achieved, overages are recognized as earned over time based on a tiered pricing structure. Overages give rise to variable consideration that is allocated to the distinct periods to which the overage relates.

63

Table of Contents

For transactions that involve third parties, the Company evaluates which party in the arrangement obtains control of the Company’s services (and is therefore the Company’s customer), which impacts whether the Company reports revenue as the gross amounts paid by the advertiser through the Demand-Side Platform or the net amount paid by the Company’s Demand-Side Platform partners. For certain arrangements, customers may purchase the Company’s service offering through a Demand-Side Platform that manages various ad campaign auctions and inventory on behalf of the advertisers. Customers elect to use the Company’s service of evaluating the quality of advertising inventory up for bid on an advertising exchange. The ability to provide these services to customers requires that the Company enter into product integration agreements with Demand-Side Platforms who in turn make the Company’s services available to advertisers. In these arrangements, the customer pays a Measured Transaction Fee to the Company (collected by the Demand-Side Platform) for the successful execution of the purchase of advertising inventory on an exchange. In these transactions, the Company transfers control of the Company’s services directly to the advertiser (who is the Company’s customer) and therefore revenue is recognized for the gross amount paid by the advertiser for the Company’s services. Specifically, the Company transfers control of the data that is influencing the purchasing decisions directly to the customer and the Company is primarily responsible for providing these services to the customer. That is, control of these services (or a right to these services) does not transfer to the Demand-Side Platform before they are transferred to the Company’s customers. Further, the Company has latitude in establishing the sales price with those customers as there is a fixed retail rate card that is included in the product integration agreements with the Demand-Side Platforms or are governed by contracts in place with the customers. Accordingly, the Company records revenue for the gross amounts of the Measured Transaction Fees paid by advertisers for these services and records the amounts retained by the Demand-Side Platforms as a cost of revenue.

Goodwill and Intangibles

Goodwill represents the excess of purchase price over the fair value of tangible net assets and identifiable intangible assets of the businesses acquired. Goodwill deemed to have an indefinite life is not amortized. Intangible assets determined to have finite lives are amortized over their useful lives. Goodwill with indefinite lives are subject to impairment testing annually as of October 1, or whenever events or changes in circumstances indicate that the carrying amount may not be fully recoverable, using the guidance and criteria described in the accounting standard for Goodwill and Other Intangible Assets. This testing compares carrying values to fair values and, when appropriate, the carrying value of these assets is reduced to fair value.

The Company has a single reporting unit. There are many assumptions and estimates used that directly impact the results of impairment testing, including an estimate of future expected revenues, net income, earnings before interest, taxes, depreciation and amortization (“EBITDA”), EBITDA margins and cash flows, useful lives, discount rates and an estimate of value using multiples derived from the stock prices of publicly traded guideline companies applied to such expected cash flows and market approaches in order to estimate fair value. The determination of whether or not goodwill or indefinite-lived acquired intangible assets have become impaired involves a significant level of judgment in the assumptions and estimates underlying the approach used to determine the value of our reporting unit. Changes in our strategy or market conditions could significantly impact these judgments and require an impairment to be recorded to intangible assets and goodwill. There have been no goodwill impairment indicators subsequent to the impairment test performed as of October 1, 2022. For each of the years ended December 31, 2022 and December 31, 2021, there were no impairments related to our intangible assets.

We allocate the fair value of the purchase consideration to the tangible assets acquired, liabilities assumed and intangible assets acquired based on their estimated fair values. The excess of the fair value of the purchase consideration over the fair values of these identifiable assets and liabilities is recorded as goodwill. Such valuations require management to make significant estimates and assumptions, especially with respect to intangible assets. The estimates used in valuing the intangible assets are determined with the assistance of third-party specialists, a discounted cash flow analysis and estimates made by management. Management’s estimates of fair value are based upon assumptions believed to be reasonable, but which are inherently uncertain and unpredictable and, as a result, actual results may differ from estimates. During the measurement period, which is not to exceed one year from the acquisition date, we may record adjustments to the assets acquired and liabilities assumed, with the corresponding offset primarily made to goodwill. Upon the conclusion of the measurement period, any subsequent adjustments are recorded to earnings.

64

Table of Contents

Stock-Based Compensation

Our stock-based compensation awards relate to restricted stock units and stock options. For purposes of calculating stock-based compensation, we estimate the fair value of the restricted stock units using the grant date stock price or a Monte Carlo Simulation model in instances where a market condition exists. We estimate the fair value of stock options issued using a Black-Scholes option-pricing model. For share-based awards that vest subject to the satisfaction of a service requirement, the fair value measurement date for stock-based compensation awards is the date of grant and the expense is recognized using the accelerated attribution method over the vesting period net of an estimated forfeiture rate. For share-based awards that vest subject to the satisfaction of a market condition, the fair value measurement date for stock-based compensation is the date of grant and the expense is recognized on a straight-line basis over the derived service period or upon achievement of the market condition.

The determination of the fair value of restricted stock units utilizing the Monte Carlo Simulation model is affected by a number of assumptions including expected volatility, risk free rate and the fair market value of the Company’s common stock.

The determination of the fair value of stock option awards utilizing the Black-Scholes model is affected by a number of assumptions, including expected volatility, expected life, risk-free interest rate, expected dividends, and the fair market value of the Company’s common stock. These inputs are subjective and generally requires significant judgment and estimation by management.

Expected Term: we have opted to use the “simplified method” for estimating the expected term of employee options, whereby the expected term equals the arithmetic average of the vesting term and the original contractual term of the option, generally 10 years.
Expected Volatility: we have based our estimate of expected volatility on the historical stock volatility of a group of similar companies that are publicly traded over a period equivalent to the expected term of the stock-based awards.
Risk-Free Interest Rate: the risk-free rate assumption is based on the U.S. Treasury instruments with maturities similar to the expected term of our stock options.
Expected Dividend: the expected dividend yield is zero as we have not paid nor do we anticipate paying any dividends on our common stock in the foreseeable future.

Prior to our common stock becoming publicly traded, we estimated the fair value of our common stock as discussed in the section “Fair Value of Common Stock” below.

Fair Value of Common Stock

Historical Valuation Approach

Given the absence of a public trading market for our common stock prior to our IPO, our board of directors exercised reasonable judgment and considered a number of objective and subjective factors to determine the best estimate of the fair value of our common stock, including, with input from management, our financial and operating history, equity market conditions affecting comparable public companies, and the lack of marketability of our common stock.

65

Table of Contents

In addition, our board of directors considered valuations of our common stock prepared by an unrelated third-party valuation firm in accordance with the guidance provided by the American Institute of Certified Public Accountants Practice Guide, Valuation of Privately-Held-Company Equity Securities Issued as Compensation. These valuations considered recent arm’s length market transactions, where applicable, estimates of future expected revenues, EBITDA, EBITDA margins and cash flows, discount rates, and an estimate of value using multiples derived from the stock prices of comparable publicly traded companies applied to such expected cash flows and market approaches in order to estimate fair value. These assumptions were incorporated in a hybrid approach used to evaluate recent arm’s length market transactions and scenarios in which the Company remained privately held or the Company completed an initial public offering. The hybrid approach included using the Option Pricing Method (OPM) and Probability-Weighted Expected Return Method (PWERM) models.

In November 2020, the Private Placement Investors invested in the Company in the Private Placement at a total enterprise value (the “Total Enterprise Value”) based on arm’s length negotiations, which resulted in a per share valuation of $17.22 (adjusted for the reverse stock split). The Total Enterprise Value represented an equity value of our common stock of approximately 14 times historical revenue for the last twelve months (“LTM Revenue”), less a discount for the lack of marketability of our common stock (“Liquidity Discount”). Based on the Total Enterprise Value from the Private Placement and our board of directors’ belief that it is customary and standard practice for high growth companies in the Company’s industry to use a revenue multiplier to value a company, our board of directors determined that the most appropriate representation of the value of the Company was to attribute value based on LTM Revenue multiplied by 14, less a Liquidity Discount. The LTM Revenue utilized in the per share valuation for the Private Placement was the twelve months ended September 30, 2020, which was the most recent month ended prior to the Company entering into a definitive agreement for the Private Placement and the most recent historical financial information provided to the Private Placement Investors.

For grants of stock options and restricted stock units subsequent to closing of the Private Placement (summarized above), our board of directors continued to utilize this formula of (LTM Revenue × 14) x Liquidity Discount. The Liquidity Discount was determined by our board of directors to be 15% for the valuation following the Private Placement, resulting in the following formula: Valuation = (LTM Revenue × 14) x 0.85. The liquidity discount decreased over time leading up to the IPO. In addition to looking at historical revenue, our board of directors also considered projected 2021 revenue in setting the valuation for grants of stock options and restricted stock units subsequent to closing of the Private Placement, primarily as a guidepost to ensure that the historical LTM revenue formula was reasonable.

Current Valuation Approach

Following the completion of our IPO, our board of directors no longer determines the fair value of our common stock in accordance with the valuation formula described above under “— Historical Valuation Approach.” Instead, our board of directors determines the fair value of our common stock based on the closing price of our common stock as reported on the date of the grant. The closing price (and therefore, the fair value) of our common stock may fluctuate significantly based on a number of factors that are outside of our control. See “Risk Factors — Risks Related to Our Common Stock — The market price of our common stock may be volatile and could decline regardless of our operating performance.”

Taxes

We account for income taxes using the asset and liability method, in accordance with ASC 740, Accounting for Income Taxes. Deferred income taxes are provided for temporary differences in recognizing certain income, expense and credit items for financial reporting purposes and tax reporting purposes. Excess tax benefits and tax deficiencies are recognized in the income tax provision in the period in which they occur.

66

Table of Contents

We record a valuation allowance when it is determined that it is more-likely-than-not that some portion or all of its deferred tax assets will not be realized. As of each reporting date, management considers new evidence, both positive and negative, that could impact management’s view with regard to the future realization of deferred tax assets. For certain tax positions, we use a more-likely-than-not threshold based on the technical merits of the tax position taken. Tax positions that meet the more-likely-than-not recognition threshold are measured as the largest amount of tax benefits determined on a cumulative probability basis, which are more-likely-than-not to be realized upon ultimate settlement in the financial statements. We recognize interest and penalties related to income tax matters in income tax expense.

Emerging Growth Company Status

The Company was an emerging growth company, as defined in the JOBS Act for the year ended December 31, 2021. Under the JOBS Act, emerging growth companies can delay adopting new or revised accounting standards issued subsequent to the enactment of the JOBS Act until such time as those standards apply to private companies. The Company elected to use this extended transition period for complying with certain new or revised accounting standards during the year ended December 31, 2021.

As a result, the Company’s financial statements for periods prior to and during which it was an emerging growth company may not be comparable to companies that comply with new or revised accounting pronouncements as of public company effective dates.

The Company no longer meets the requirement of being an emerging growth company and has filed its Annual Report on Form 10-K for the fiscal year ended December 31, 2022 as a large accelerated filer.

Recent Accounting Pronouncements

See Note 2, Basis of Presentation and Summary of Significant Accounting Policies to our audited consolidated financial statements included elsewhere in this Annual Report on Form 10-K for more information on the adoption of recent accounting pronouncements.

67

Table of Contents

Item 7A. Quantitative and Qualitative Disclosure about Market Risk

Interest Rate Risk

We are exposed to market risks in the ordinary course of our business. These risks primarily include interest rate sensitivities. Our cash, cash equivalents and short-term investments as of December 31, 2022, December 31, 2021 and December 31, 2020 consisted of $267.8 million, $221.6 million and $33.4 million, respectively, in bank deposits and money market funds. Such interest-earning instruments carry a degree of interest rate risk. However, we believe that we do not have any material exposure to changes in the fair value of these assets as a result of changes in interest rates due to the short-term nature of our cash, cash equivalents and short-term investments. As of December 31, 2022, December 31, 2021 and December 31, 2020, we had $0, $0 and $22.0 million, respectively, in variable rate debt outstanding. The New Revolving Credit Facility entered into on October 1, 2020 matures in October 2025 and accrues interest at LIBOR plus a floating rate per annum. As of December 31, 2022, we have no outstanding variable rate indebtedness and have $150 million of availability under the New Revolving Credit Facility.

Foreign Currency Exchange Risk

As we expand internationally, our results of operations and cash flows may become increasingly subject to fluctuations due to changes in foreign currency exchange rates. Our revenue is denominated primarily in U.S. dollars. Our expenses are generally denominated in the currencies in which our operations are located, which is primarily in the United States. Movements in foreign currency exchange rates versus the U.S. dollar did not have a material effect on our revenue for 2022. A hypothetical 10% change in exchange rates versus the U.S. dollar would not have resulted in a material change to our 2022 earnings. As our operations in countries outside of the United States grow, our results of operations and cash flows may be subject to fluctuations due to changes in foreign currency exchange rates, which could harm our business in the future. To date, we have not entered into any material foreign currency hedging contracts, although we may do so in the future.

68

Table of Contents

Item 8. Financial Statements and Supplementary Data

DOUBLEVERIFY HOLDINGS, INC.

INDEX TO CONSOLIDATED FINANCIAL STATEMENTS

Page

Reports of Independent Registered Public Accounting Firm (PCAOB ID 34)

70

Consolidated Balance Sheets

74

Consolidated Statements of Operations and Comprehensive Income

75

Consolidated Statements of Stockholders’ Equity

76

Consolidated Statements of Cash Flows

77

Notes to Consolidated Financial Statements

78

69

Table of Contents

REPORT OF INDEPENDENT REGISTERED PUBLIC ACCOUNTING FIRM

To the Stockholders and the Board of Directors of DoubleVerify Holdings, Inc.

Opinion on the Financial Statements

We have audited the accompanying consolidated balance sheets of DoubleVerify Holdings, Inc. and subsidiaries (the “Company”) as of December 31, 2022 and 2021, the related consolidated statements of operations and comprehensive income, stockholders’ equity, and cash flows, for each of the three years in the period ended December 31, 2022, and the related notes and the schedules listed in the Index to the consolidated financial statements (collectively referred to as the “financial statements”). In our opinion, the financial statements present fairly, in all material respects, the financial position of the Company as of December 31, 2022 and 2021, and the results of its operations and its cash flows for each of the three years in the period ended December 31, 2022, in conformity with accounting principles generally accepted in the United States of America.

We have also audited, in accordance with the standards of the Public Company Accounting Oversight Board (United States) (PCAOB), the Company’s internal control over financial reporting as of December 31, 2022, based on criteria established in Internal Control — Integrated Framework (2013) issued by the Committee of Sponsoring Organizations of the Treadway Commission and our report dated March 1, 2023, expressed an unqualified opinion on the Company’s internal control over financial reporting.

Basis for Opinion

These financial statements are the responsibility of the Company’s management. Our responsibility is to express an opinion on the Company’s financial statements based on our audits. We are a public accounting firm registered with the PCAOB and are required to be independent with respect to the Company in accordance with the U.S. federal securities laws and the applicable rules and regulations of the Securities and Exchange Commission and the PCAOB. We conducted our audits in accordance with the standards of the PCAOB. Those standards require that we plan and perform the audit to obtain reasonable assurance about whether the financial statements are free of material misstatement, whether due to error or fraud. Our audits included performing procedures to assess the risks of material misstatement of the financial statements, whether due to error or fraud, and performing procedures that respond to those risks. Such procedures included examining, on a test basis, evidence regarding the amounts and disclosures in the financial statements. Our audits also included evaluating the accounting principles used and significant estimates made by management, as well as evaluating the overall presentation of the financial statements. We believe that our audits provide a reasonable basis for our opinion.

Change in Accounting Principle

As discussed in Note 2 to the financial statements, the Company has changed its method of accounting for leases as of January 1, 2022 due to the adoption of Accounting Standards Update No. 2016-02, Leases (Topic 842), using the modified retrospective approach.

Critical Audit Matter

The critical audit matter communicated below is a matter arising from the current-period audit of the financial statements that was communicated or required to be communicated to the audit committee and that (1) relates to accounts or disclosures that are material to the financial statements and (2) involved our especially challenging, subjective, or complex judgments. The communication of critical audit matters does not alter in any way our opinion on the financial statements, taken as a whole, and we are not, by communicating the critical audit matter below, providing a separate opinion on the critical audit matter or on the accounts or disclosures to which it relates.

70

Table of Contents

Revenue - Refer to Notes 2 and 3 to the financial statements

Critical Audit Matter Description

As described in Note 2 of the consolidated financial statements, the Company recorded $452 million of total revenue for the year ended December 31, 2022, comprised of Measurement, Activation, and Supply-side customer arrangements.

Revenue generated from the Company’s Measurement arrangements (f/k/a Advertiser – direct) was $158 million. The Company’s Measurement revenue consists of fees earned on a high volume of individually low monetary-value transactions, sourced from multiple systems, databases, and other tools. The initiation, processing, and recording of Measurement revenue is highly automated and is based on contractual terms with advertisers.

In addition, the Company enters into customer arrangements with non-standard terms and conditions including pricing variability through tiered pricing and/or include both Measurement and Activation (f/k/a Advertiser – programmatic) services. These non-standard terms require the Company to apply incremental judgements to determine the distinct performance obligations and the timing of revenue recognition.

We identified Measurement revenue as a critical audit matter because the Company’s process to record revenue is highly dependent on the effective design and operation of multiple systems, processes, data sources, and controls. This required an increased extent of effort, including the need to involve professionals with expertise in information technology (“IT”) to identify, test, and evaluate the revenue data flows, systems, and automated controls.

In addition, the related audit effort in evaluating management’s judgments in determining revenue recognition for the non-standard customer arrangements across all revenue types was extensive and required a high degree of auditor judgment.

How the Critical Audit Matter Was Addressed in the Audit

Our audit procedures related to the Company’s Measurement revenue included the following, amongst others:

With the assistance of our IT specialists, we:
oIdentified the relevant systems used to calculate and record revenue transactions.

oTested the effectiveness of general IT controls over the relevant systems, including testing of user access controls, change management controls, and IT operations controls.

oTested the effectiveness of system interface controls and automated controls within the relevant revenue streams.

oTested effectiveness of controls to reconcile the relevant system to the Companys general ledgers.

With the assistance of our data specialists, we created data visualizations to evaluate recorded revenue and evaluate trends in the transactional revenue data.

We selected a sample of transactions and traced the transactions through the Companys proprietary systems.

We selected a sample of transactions and agreed the amounts recognized to source documents and tested the mathematical accuracy of the recorded revenue.

71

Table of Contents

Our audit procedures related to the Company’s non-standard customer arrangements included the following, amongst others:

We tested the effectiveness of controls related to the identification of distinct performance obligations, the determination of the timing of revenue recognition, and the estimation of variable consideration.
We selected a sample of customer agreements and performed the following procedures:

oObtained and read contract source documents for each selection, including master agreements, and other documents that were part of the agreement.
oTested management’s identification and accounting treatment of distinct performance obligations in the contract terms.
oTo the extent a contract did not represent a single distinct performance obligation, we tested the allocation of the transaction price to each distinct performance obligation by comparing the relative standalone selling prices of similar goods or services.

/s/ Deloitte & Touche LLP

New York, New York

March 1, 2023

We have served as the Company’s auditor since 2019.

72

Table of Contents

REPORT OF INDEPENDENT REGISTERED PUBLIC ACCOUNTING FIRM

To the Stockholders and the Board of Directors of DoubleVerify Holdings, Inc.

Opinion on Internal Control over Financial Reporting

We have audited the internal control over financial reporting of DoubleVerify Holdings, Inc. and subsidiaries (the “Company”) as of December 31, 2022, based on criteria established in Internal Control — Integrated Framework (2013) issued by the Committee of Sponsoring Organizations of the Treadway Commission (COSO). In our opinion, the Company maintained, in all material respects, effective internal control over financial reporting as of December 31, 2022, based on criteria established in Internal Control — Integrated Framework (2013) issued by COSO.

We have also audited, in accordance with the standards of the Public Company Accounting Oversight Board (United States) (PCAOB), the consolidated financial statements as of and for the year ended December 31, 2022, of the Company and our report dated March 1, 2023, expressed an unqualified opinion on those consolidated financial statements and included an explanatory paragraph regarding the adoption of Accounting Standards Update No. 2016-02, Leases (Topic 842), using the modified retrospective approach.

Basis for Opinion

The Company’s management is responsible for maintaining effective internal control over financial reporting and for its assessment of the effectiveness of internal control over financial reporting, included in the accompanying Management’s Report on Internal Control over Financial Reporting. Our responsibility is to express an opinion on the Company’s internal control over financial reporting based on our audit. We are a public accounting firm registered with the PCAOB and are required to be independent with respect to the Company in accordance with the U.S. federal securities laws and the applicable rules and regulations of the Securities and Exchange Commission and the PCAOB.

We conducted our audit in accordance with the standards of the PCAOB. Those standards require that we plan and perform the audit to obtain reasonable assurance about whether effective internal control over financial reporting was maintained in all material respects. Our audit included obtaining an understanding of internal control over financial reporting, assessing the risk that a material weakness exists, testing and evaluating the design and operating effectiveness of internal control based on the assessed risk, and performing such other procedures as we considered necessary in the circumstances. We believe that our audit provides a reasonable basis for our opinion.

Definition and Limitations of Internal Control over Financial Reporting

A company’s internal control over financial reporting is a process designed to provide reasonable assurance regarding the reliability of financial reporting and the preparation of financial statements for external purposes in accordance with generally accepted accounting principles. A company’s internal control over financial reporting includes those policies and procedures that (1) pertain to the maintenance of records that, in reasonable detail, accurately and fairly reflect the transactions and dispositions of the assets of the company; (2) provide reasonable assurance that transactions are recorded as necessary to permit preparation of financial statements in accordance with generally accepted accounting principles, and that receipts and expenditures of the company are being made only in accordance with authorizations of management and directors of the company; and (3) provide reasonable assurance regarding prevention or timely detection of unauthorized acquisition, use, or disposition of the company’s assets that could have a material effect on the financial statements.

Because of its inherent limitations, internal control over financial reporting may not prevent or detect misstatements. Also, projections of any evaluation of effectiveness to future periods are subject to the risk that controls may become inadequate because of changes in conditions, or that the degree of compliance with the policies or procedures may deteriorate.

/s/ Deloitte & Touche LLP

New York, New York

March 1, 2023

73

Table of Contents

DoubleVerify Holdings, Inc.

CONSOLIDATED BALANCE SHEETS

As of December 31, 

(in thousands, except per share data)


2022


2021

Assets:

Current assets


Cash and cash equivalents

$

267,813

$

221,591

Trade receivables, net of allowances for doubtful accounts of $8,893 and $6,527 as of December 31, 2022 and December 31, 2021, respectively


167,122

122,938

Prepaid expenses and other current assets


10,161

23,295

Total current assets


445,096


367,824

Property, plant and equipment, net


47,034

17,575

Operating lease right-of-use assets, net

64,692

Goodwill


343,011

350,560

Intangible assets, net


135,429

153,395

Deferred tax assets


35

60

Other non‑current assets


1,731

2,780

Total assets

$

1,037,028

$

892,194

Liabilities and Stockholder’s Equity:


Current liabilities


Trade payables

$

6,675

$

3,853

Accrued expense


33,085

41,456

Operating lease liabilities, current

7,041

Income tax liabilities


11,953

1,321

Current portion of finance lease obligations


1,846

1,970

Contingent consideration current


1,717

Other current liabilities


8,310

6,716

Total current liabilities


68,910


57,033

Operating lease liabilities, non-current

74,086

Finance lease obligations


779

2,579

Deferred tax liabilities


12,890

30,307

Other non‑current liabilities


3,504

3,209

Total liabilities

$

160,169

$

93,128

Commitments and contingencies (Note 15)


Stockholders’ equity


Common stock, $0.001 par value, 1,000,000 shares authorized, 165,448 shares issued and 165,417 outstanding as of December 31, 2022; 1,000,000 shares authorized, 162,347 shares issued and 162,297 outstanding as of December 31, 2021


165


162

Additional paid‑in capital


756,299


717,228

Treasury stock, at cost, 31 shares and 50 shares as of December 31, 2022 and December 31, 2021, respectively


(796)


(1,802)

Retained earnings


127,517


84,249

Accumulated other comprehensive loss, net of income taxes


(6,326)


(771)

Total stockholders’ equity


876,859

799,066

Total liabilities and stockholders’ equity

$

1,037,028

$

892,194

See accompanying Notes to Consolidated Financial Statements.

74

Table of Contents

DoubleVerify Holdings, Inc.

CONSOLIDATED STATEMENTS OF OPERATIONS AND COMPREHENSIVE INCOME

Year Ended December 31, 

(in thousands, except per share data)


2022


2021


2020

Revenue

$

452,418

$

332,741

$

243,917

Cost of revenue (exclusive of depreciation and amortization shown separately below)


77,866


54,382


35,750

Product development


95,118


62,698


47,004

Sales, marketing and customer support


107,416


77,312


62,157

General and administrative


78,666


81,380


53,056

Depreciation and amortization


34,328


30,285


24,595

Income from operations


59,024


26,684


21,355

Interest expense


905


1,172


4,931

Other income, net


(1,249)


(309)


(885)

Income before income taxes


59,368


25,821


17,309

Income tax expense (benefit)


16,100

(3,487)


(3,144)

Net income

$

43,268

$

29,308

$

20,453

Earnings per share:


Basic

$

0.26

$

0.20

$

0.15

Diluted

$

0.25

$

0.18

$

0.14

Weighted‑average common stock outstanding:


Basic


163,882


148,309


138,072

Diluted


170,755


160,264


145,443

Comprehensive income:


Net income

$

43,268

$

29,308

$

20,453

Other comprehensive (loss) income:


Foreign currency cumulative translation adjustment


(5,555)


(1,782)


1,078

Total comprehensive income

$

37,713

$

27,526

$

21,531

See accompanying Notes to Consolidated Financial Statements.

75

Table of Contents

DoubleVerify Holdings, Inc.

CONSOLIDATED STATEMENTS OF STOCKHOLDERS’ EQUITY

Accumulated

Other

Comprehensive

Common Stock

Preferred Stock

Additional

(Loss) Income

Total

Shares

Shares

Treasury Stock

Paidin

Retained

Net of

Stockholders’

(in thousands)


Issued


Amount


Issued


Amount


Shares


Amount


Capital


Earnings


Income Taxes


Equity

Balances as of January 1, 2020

139,721

$

140

$

$

$

283,457

$

34,488

$

(67)

$

318,018

Foreign currency translation adjustment


1,078


1,078

Stock-based compensation


5,984


5,984

Exchange of common stock for Series A preferred stock


45,438


454


15,146


(260,686)


260,232


Additional Series A preferred stock issuance, net of issuance costs

15,568

156

85,308

85,464

Repurchase of vested options

(15,506)

(15,506)

Common stock issued under employee purchase plan

61

424

424

Common stock issued upon exercise of stock options

255

780

780

Common stock issued upon vesting of restricted stock units


185


Net income


20,453


20,453

Balances as of December 31, 2020


140,222

$

140


61,006

$

610


15,146

$

(260,686)

$

620,679

$

54,941

$

1,011

$

416,695

Foreign currency translation adjustment


(1,782)


(1,782)

Shares repurchased for settlement of employee tax withholdings


50


(1,802)


(1,802)

Issuance of common stock as consideration for acquisition


684


1


22,525


22,526

Stock-based compensation

21,887

21,887

Common stock issued under employee purchase plan

15

404

404

Common stock issued upon exercise of stock options

4,782

5

12,435

12,440

Common stock issued upon vesting of restricted stock units


366


Conversion of Series A preferred stock to common stock


5,190


5


(61,006)


(610)


(15,146)


260,686


(260,081)


Issuance of common stock upon initial public offering

9,977

10

269,380

269,390

Private placement stock issuance concurrent with initial public offering

1,111

1

29,999

30,000

Net income

29,308

29,308

Balances as of December 31, 2021


162,347

$

162


$


50

$

(1,802)

$

717,228

$

84,249

$

(771)

$

799,066

Foreign currency translation adjustment


(5,555)


(5,555)

Shares repurchased for settlement of employee tax withholdings


402


(10,244)


(10,244)

Stock-based compensation expense


42,787


42,787

Common stock issued to non-employees


4


Common stock issued upon exercise of stock options


1,518


2


5,801


5,803

Common stock issued upon vesting of restricted stock units


1,488


1


(1)


Common stock issued under employee purchase plan


91


1,734


1,734

Treasury stock reissued upon settlement of equity awards


(421)


11,250


(11,250)


Net income

43,268

43,268

Balances as of December 31, 2022


165,448

$

165


$


31

$

(796)

$

756,299

$

127,517

$

(6,326)

$

876,859

See accompanying Notes to Consolidated Financial Statements.

76

Table of Contents

DoubleVerify Holdings, Inc.

CONSOLIDATED STATEMENTS OF CASH FLOWS

Year Ended December 31, 

(in thousands)


2022


2021


2020

Operating activities:

Net income

$

43,268

$

29,308

$

20,453

Adjustments to reconcile net income to net cash provided by operating activities


Bad debt expense (recovery)


5,033


(711)


4,811

Depreciation and amortization expense


34,328


30,285


24,595

Amortization of debt issuance costs


294


294


285

Non-cash lease expense


7,339


Loss on extinguishment of debt


350

Accretion of acquisition liabilities


36

Deferred taxes


(19,581)


(7,866)


(5,137)

Stock-based compensation expense


42,307


21,887


5,984

Interest expense (income)


107


103


(12)

Loss on disposal of fixed assets


1,353


Impairment of long-lived assets


1,510


Change in fair value of contingent consideration

57

(949)

Offering costs

22,074

3,555

Other

87

733

673

Changes in operating assets and liabilities, net of effects of business combinations


Trade receivables


(49,765)


(22,004)


(30,443)

Prepaid expenses and other assets


9,094


(7,567)


(9,013)

Trade payables


2,884


(49)


2,482

Accrued expenses and other liabilities


16,604


16,205


3,546

Net cash provided by operating activities


94,862


82,749


21,216

Investing activities:


Purchase of property, plant and equipment


(39,981)


(9,397)


(9,751)

Acquisition of businesses, net of cash acquired


(149,217)


Net cash used in investing activities


(39,981)


(158,614)


(9,751)

Financing activities:


Proceeds from long-term debt


89,650

Payments of long-term debt


(22,000)


(142,113)

Deferred payment related to Leiki acquisition


(2,033)

Deferred payment related to Zentrick acquisition


(50)


(50)

Payment of contingent consideration related to Zentrick acquisition


(3,247)


(601)

Repurchase of vested options


(15,506)

Proceeds from Series A preferred stock issuance, net of issuance costs


346,150

Payments to shareholders for preferred stock Series A


(260,686)

Proceeds from common stock issued upon exercise of stock options


5,803


12,440


780

Proceeds from common stock issued under employee purchase plan


1,734


404


424

Proceeds from issuance of common stock upon initial public offering


269,390


Proceeds from issuance of common stock in connection to concurrent private placement


30,000


Payments related to offering costs


(6)


(22,069)


(3,610)

Payments related to debt issuance costs

(577)

Finance lease payments

(1,924)

(1,918)

(1,443)

Shares repurchased for settlement of employee tax withholdings

(10,244)

(1,802)

Net cash (used in) provided by financing activities


(7,884)


264,395


10,385

Effect of exchange rate changes on cash and cash equivalents and restricted cash


(784)


(200)


203

Net increase in cash, cash equivalents, and restricted cash


46,213


188,330


22,053

Cash, cash equivalents, and restricted cash—Beginning of period


221,725


33,395


11,342

Cash, cash equivalents, and restricted cash—End of period

$

267,938

$

221,725

$

33,395

Cash and cash equivalents

$

267,813

$

221,591

$

33,354

Restricted cash (included in prepaid expenses and other assets on the Consolidated Balance Sheets)


125


134


41

Total cash and cash equivalents and restricted cash

$

267,938

$

221,725

$

33,395

Supplemental cash flow information:


Cash paid for taxes


12,351


7,698


16,180

Cash paid for interest


554


774


3,369

Noncash investing and financing transactions:


Common stock issued in connection with acquisition


22,526


Exchange of common stock for preferred stock

260,686

Right-of-use assets obtained in exchange for new operating lease liabilities, net of impairments and tenant improvement allowances

71,979

Acquisition of equipment under finance lease

1,518

1,603

Capital assets financed by accounts payable


12


36


Treasury stock reissued upon the conversion of Series A preferred stock for common stock

260,686

Offering costs included in accounts payable and accrued expense


5


75

Stock-based compensation included in capitalized software development costs


480


See accompanying Notes to Consolidated Financial Statements.

77

Table of Contents

DoubleVerify Holdings, Inc.

NOTES TO CONSOLIDATED FINANCIAL STATEMENTS

(Amounts in thousands, except per share data, unless otherwise stated)

1. Description of Business

DoubleVerify Holdings, Inc. (the “Company”) is a leading software platform for digital media measurement and analytics. Our mission is to create stronger, safer, more secure digital transactions that drive optimal outcomes for global advertisers. Through our software platform and the metrics it provides, we help preserve the fair value exchange between buyers and sellers of digital media. The Company’s solutions provide advertisers unbiased data analytics that enable advertisers to increase the effectiveness, quality and return on their digital advertising investments. The DV Authentic Ad is our proprietary metric of digital media quality, which measures whether a digital ad was delivered in a brand suitable environment, fully viewable, by a real person and in the intended geography. The Company’s software interface, DV Pinnacle, delivers these metrics to our customers in real time, allowing them to access critical performance data on their digital transactions. The Company’s software solutions are integrated across the entire digital advertising ecosystem, including programmatic platforms, social media channels and digital publishers. The Company’s solutions are accredited by the Media Rating Council, which allows the Company’s data to be used as a single source standard in the evaluation and measurement of digital ads.

The Company was incorporated on August 16, 2017, is registered in the state of Delaware and is the parent company of DoubleVerify Midco, Inc. (“MidCo”), which is in turn the parent company of DoubleVerify Inc. On August 18, 2017, DoubleVerify Inc. entered into an agreement and plan of merger (the “Agreement”), whereby the Company and Pixel Merger Sub, Inc. (“Merger Sub”), a wholly-owned subsidiary of the Company, agreed to provide for the merger of the Merger Sub with DoubleVerify Inc. pursuant to the terms and conditions of the Agreement.

On the effective date, Merger Sub was merged with and into DoubleVerify Inc. whereupon the separate corporate existence of Merger Sub ceased and DoubleVerify Inc. continued as the surviving corporation.

Through the merger, the Company acquired 100% of the outstanding equity instruments of DoubleVerify Inc., (the “Acquisition”) resulting in a change of control at the parent level. The merger resulted in the application of acquisition accounting under the provisions of Financial Accounting Standards Board (“FASB”) Topic Accounting Standards Codification (“ASC”) 805, “Business Combinations.”

The Company is headquartered in New York, New York and has wholly-owned subsidiaries in numerous jurisdictions including Israel, the United Kingdom, the United Arab Emirates, Germany, Singapore, Australia, Canada, Brazil, Belgium, Mexico, France, Japan, Spain, and Finland, and operates in one reportable segment.

On April 23, 2021, the Company completed an IPO. See Footnote 14, Stockholders’ Equity.

2. Basis of Presentation and Summary of Significant Accounting Policies

Basis of Preparation and Principles of Consolidation

The accompanying Consolidated Financial Statements have been prepared in conformity with accounting principles generally accepted in the United States of America (“GAAP”) and reflect the financial statements of the Company and all of its subsidiaries. All intercompany balances and transactions have been eliminated in consolidation.

78

Table of Contents

In the Consolidated Statements of Cash Flows for the years ended December 31, 2022, 2021 and 2020, the Company changed the presentation in describing the changes in operating assets and liabilities by combining the lines for Accrued expenses, Other current liabilities, and Other non-current liabilities into a single line item. The Company further combined Prepaid expenses and other current assets and Other non-current assets into a single line item. Both the original and new presentations are in accordance with the applicable financial reporting framework and the change was applied retrospectively solely to enhance the comparability with the current Consolidated Statements of Cash Flows.

On March 29, 2021, the Company effected a 1-for-3 reverse stock split (“reverse stock split”) of its outstanding common stock and a proportional adjustment to the existing conversion ratio for the preferred stock described in Footnote 14, Stockholders’ Equity. Accordingly, all share and per share amounts for all periods presented in these consolidated financial statements and notes thereto, have been adjusted retrospectively, where applicable, to reflect this reverse stock split.

Use of Estimates and Judgments in the Preparation of the Consolidated Financial Statements

The preparation of financial statements in conformity with GAAP requires management to make estimates and assumptions that affect the reported amounts of assets and liabilities and the reported amounts of revenue and expense during the reporting periods. Significant estimates and judgments are inherent in the analysis and measurement of items including, but not limited to: revenue recognition criteria including the determination of principal versus agent revenue considerations, income taxes, the valuation and recoverability of goodwill and intangible assets, the assessment of potential loss from contingencies, assumptions in valuing acquired assets and liabilities assumed in business combinations, the allowance for doubtful accounts, and assumptions used in determining the fair value of stock-based compensation. Management bases its estimates and assumptions on historical experience and on various other factors that are believed to be reasonable under the circumstances. Due to the inherent uncertainty involved in making estimates, actual results reported in future periods may be affected by changes in these estimates. These estimates are based on the information available as of the date of the Consolidated Financial Statements.

Segment Reporting

The Company’s operating segments are determined based on the units that constitute a business for which discrete financial information is available and for which operating results are regularly reviewed by the Chief Operating Decision Maker (“CODM”). The CODM is the highest level of management responsible for assessing the Company’s overall performance and making operational decisions. The Company operates in one single operating and reportable segment.

Fair Value Measurements

The Company evaluates the fair value of certain assets and liabilities using the fair value hierarchy. Fair value is an exit price representing the amount that would be received in the sale of an asset or paid to transfer a liability in an orderly transaction between market participants. As such, fair value is a market-based measurement that should be determined based on assumptions that market participants would use in pricing an asset or liability. As a basis for considering such assumptions, the Company applies the three-tier GAAP value hierarchy which prioritizes the inputs used in measuring fair value as follows:

Level 1—observable inputs such as quoted prices in active markets;

Level 2—inputs other than the quoted prices in active markets that are observable either directly or indirectly;

Level 3—unobservable inputs of which there is little or no market data, which require the Company to develop its own assumptions.

Financial assets and liabilities are classified in their entirety based on the lowest level of input that is significant to the fair value measure.

The carrying amounts of accounts receivable, accounts payable, accrued expenses and other current liabilities approximate fair value due to the short-term nature of these instruments.

79

Table of Contents

Foreign Currency

A majority of the Company’s revenues are generated in U.S. dollars. In addition, most of the Company’s costs are denominated and determined in U.S. dollars. Thus, the reporting currency of the Company is the U.S. dollar.

The functional currency of the Company’s foreign subsidiaries is generally the local currency. The assets and liabilities of subsidiaries whose functional currency is a foreign currency are translated at the period-end exchange rates. Income statement items are translated at the average monthly rates for the year. The resulting translation adjustment is recorded as a component of Accumulated other comprehensive (loss) income, net of income taxes and is included in the Consolidated Statement of Stockholders’ Equity.

For the years ended December 31, 2022, 2021, and 2020, the Company recorded an aggregate transaction loss of $1.1 million, an aggregate transaction gain of $0.1 million, and an aggregate transaction loss of $0.5 million, respectively. The aggregate transaction gains or losses were recorded in Other income, net in the Consolidated Statement of Operations and Comprehensive Income.

Cash and Cash Equivalents

The Company considers all short-term highly liquid investments with an original maturity at the date of purchase of three months or less to be cash equivalents. Pursuant to the Company’s investment policy, its surplus funds are kept as cash or cash equivalents in money market funds and savings accounts to reduce its exposure to market risk.

Trade Receivables Net of Allowances for Doubtful Accounts

Trade receivables are non-interest bearing and are stated at gross invoice amounts. A receivable is recorded when the Company has an unconditional right to receive payment based on the satisfaction of performance obligations, such that only the passage of time is required before consideration is due, regardless of whether amounts are billed or unbilled. Included in trade receivables on the Consolidated Balance Sheets are unbilled receivable balances which have not yet been invoiced.

On January 1, 2022, the Company adopted Account Standards Update (“ASU”) No. 2016-13, Financial Instruments-Credit Losses (Topic 326): Measurement of Credit Losses on Financial Instruments (“ASC 326”), to assess the allowance for doubtful accounts. The Company used the modified retrospective transition method, which did not result in a cumulative-effect adjustment to the opening balance of retained earnings to be recognized on the date of adoption. ASC 326 requires the measurement of all expected credit losses for financial assets held at the reporting date is based on historical experience, current conditions, and reasonable and supportable forecasts. As a result, the Company incorporated an expected loss methodology for its accounts receivable and the related allowance for doubtful accounts. In addition, the Company continues to evaluate specific accounts where information indicates the customers may have an inability to meet financial obligations, such as bankruptcy proceedings and receivable amounts outstanding for an extended period beyond contractual terms.

Write-offs of accounts receivable are taken in the period when the Company has exhausted its efforts to collect overdue and unpaid receivables or otherwise has evaluated other circumstances that indicate that the Company should abandon such efforts.

The following table presents changes in the accounts receivable allowance for doubtful accounts:

Year Ended December 31, 

(in thousands)


2022


2021


2020

Beginning balance

$

6,527

$

7,049

$

4,599

Add: bad debt expense (recoveries)


5,033


(711)


4,811

Less: write offs, net of recoveries


(2,667)


189


(2,361)

Ending balance

$

8,893

$

6,527

$

7,049

80

Table of Contents

Prepaid Expenses and Other Current Assets

Prepaid expenses and other current assets on the Consolidated Balance Sheets consist primarily of prepaid taxes, other general prepaid expenses, prepaid insurance, and value added tax assets. Any expenses paid prior to the related services being rendered are recorded as prepaid expenses and amortized over the period of service.

Restricted cash represents amounts pledged as collateral for certain agreements with third parties. Upon satisfying the terms of the agreements, the funds are expected to be released and available for use by the Company. As of December 31, 2022 and 2021, the Company had $0.1 million of restricted cash.

As of December 31, 2022 and 2021, the Company had prepaid income taxes of $2.4 million and $14.4 million, respectively.

Property, Plant and Equipment, Net

Property, plant and equipment are stated at cost, net of accumulated depreciation. Depreciation is calculated using the straight-line method over the following estimated useful lives of the assets:

Computers and peripheral equipment


3 years

Office furniture and equipment

4 - 7 years

Leasehold improvements


Remaining lease term

Assets under finance leases are recorded at their net present value at the inception of the lease. Assets under finance leases and leasehold improvements are amortized over the shorter of the related lease terms or their useful lives.

Expenditures which significantly improve or extend the life of an asset are capitalized, while charges for routine maintenance and repairs are expensed during the year incurred.

Capitalized Software

Capitalized software, which is included in Property, plant and equipment, net, consists of costs to purchase and develop internal-use software, which the Company uses to provide services to its customers. The costs to purchase and develop internal-use software are capitalized from the time that the preliminary project stage is completed, and it is considered probable that the software will be used to perform the function intended. These costs include personnel and related employee benefits for employees directly associated with the software development and external costs of the materials or services consumed in developing or obtaining the software. Any costs incurred during subsequent efforts to upgrade and enhance the functionality of the software are also capitalized. Once this software is ready for use in the Company’s products, these costs are amortized on a straight-line basis over the estimated useful life of the software, which is 3 years. During the years ended December 31, 2022 and December 31, 2021, the Company capitalized $7.0 million and $6.6 million in internal-use software cost, respectively. Amortization expense was $5.5 million, $3.7 million, and $1.4 million on capitalized internal-use software costs during the years ended December 31, 2022, 2021 and 2020, respectively. This is included within Depreciation and amortization in the Consolidated Statement of Operations and Comprehensive Income.

81

Table of Contents

Leases

The Company has operating and financing leases for corporate offices, data centers, and certain equipment. The Company determines if an arrangement is a lease at inception and does not recognize a right-of-use (“ROU”) asset or lease liability with a term shorter than 12 months. Additionally, the Company does not separate lease components from non-lease components for the specified asset classes. An ROU asset represents the Company’s right to use an underlying asset for the lease term and lease liabilities represent its obligation to make lease payments arising from the lease. Operating lease ROU assets and lease liabilities are to be recognized at commencement date based on the present value of lease payments not yet paid over the lease term. As the Company’s operating leases do not provide an implicit rate, the Company uses an incremental borrowing rate based on the information available on the adoption date in determining the present value of lease payments not yet paid. The incremental borrowing rate for United States dollar denominated leases was calculated by considering current market yields and the Company’s existing debt rates to determine a yield. In order to assess a premium or discount for the lease tenor and develop an incremental borrowing rate curve, the analysis compared the Company’s existing debt yield to the appropriate market yield curve corresponding to the Company’s secured rating. The curve one notch higher was used as the incremental borrowing rate focuses on secured borrowing rates, which tend to carry higher credit ratings when issued. The corporate yield curve was adjusted based on the Company’s implied incremental borrowing rate premium or discount at each tenor to reach a concluded incremental borrowing rate curve. Using the calculated United States dollar incremental borrowing rate, the international incremental borrowing rates were determined by adjusting for specific country risk.

The operating lease ROU assets include any lease payments made prior to the rent commencement date and exclude lease incentives. Lease expense for lease payments is recognized on a straight-line basis over the lease term. Operating lease transactions are included in Operating lease right-of-use assets, net, and Operating lease liabilities, current and noncurrent, within the accompanying Consolidated Balance Sheets. Finance leases, formerly known as (“f/k/a”) capital leases, are included in Property, plant and equipment, net, Current portion of finance lease obligations, and Finance lease obligations within the accompanying Consolidated Balance Sheets. Refer to Footnote 7, Leases, for further information.

Business Combinations

The Company recognizes assets acquired and liabilities assumed at their fair value on the acquisition date. The Company allocates the purchase price of a business combination, which is the sum of the consideration provided, which may consist of cash, equity or a combination of the two, to the identifiable assets and liabilities of the acquired business at their acquisition date fair values. Any excess consideration over the fair value of assets acquired and liabilities assumed is recognized as goodwill.

Determining the fair value of assets acquired and liabilities assumed requires management to use significant judgment and estimates including the selection of valuation methodologies, estimates of future revenues and cash flows, discount rates and selection of comparable companies.

The Company estimates the fair value of intangible assets acquired generally using a discounted cash flow approach, which includes an analysis of the future cash flows expected to be generated by the asset and the risk associated with achieving these cash flows. The key assumptions used in the discounted cash flow model include the discount rate that is applied to the forecasted future cash flows to calculate the present value of those cash flows and the estimate of future cash flows attributable to the acquired intangible asset, which include revenue, expenses and taxes. The carrying value of acquired working capital assets and liabilities approximates its fair value, given the short-term nature of these assets and liabilities.

Acquisition-related costs are expensed as incurred.

Goodwill

Goodwill represents the excess of purchase price over the fair value of tangible net assets and identifiable intangible assets of the businesses acquired.

82

Table of Contents

The valuation of goodwill involves the use of management’s estimates and assumptions. The carrying value of goodwill is not amortized, but rather, is evaluated for impairment at least annually, as of October 1, and, additionally on an interim basis, whenever events or changes in circumstances indicate that the carrying amount of goodwill will not be recoverable. The Company performs this evaluation by comparing the fair value of a reporting unit to its carrying value, including goodwill recorded by the reporting unit.

The Company has a single reporting unit. The Company’s review for impairment includes an assessment of qualitative factors to determine whether it is more likely than not that the fair value of a reporting unit is less than its carrying value. If it is determined that it is more likely than not that the fair value of a reporting unit is less than its carrying value, the Company performs a quantitative goodwill impairment test, which compares the fair value of the reporting unit with its carrying amounts. The Company estimates the fair value of its reporting unit considering both income and market-based approaches. The estimated fair value of a reporting unit is determined based on assumptions regarding estimated future cash flows, discount rates, long-term growth rates and market values.

The Company completed its analyses for each of the years ended December 31, 2022, 2021, and 2020 and determined that there was no impairment of goodwill.

Intangible Assets, Net

Intangible assets with finite lives are amortized on a straight-line basis over their estimated useful lives.

The estimated useful lives of the Company’s finite-lived intangible assets are as follows:

Trademarks and brands


5 - 15 years

Customer relationships

5 - 14 years

Developed technology


4 - 8 years

Non-compete agreements


2 years

Impairment of Long-Lived Assets

Long-lived assets, such as property and equipment, ROU assets, and intangible assets subject to depreciation and amortization, are reviewed for impairment whenever events or changes in circumstances indicate that the carrying value of these assets may not be recoverable or that the useful life is shorter than the Company had originally estimated. Recoverability of these assets is measured by comparison of the carrying amount of each asset or asset group to the future undiscounted cash flows the asset or asset group is expected to generate over their remaining lives. If the asset or asset group is considered to be impaired, the amount of any impairment is measured as the difference between the carrying value and the fair value of the impaired asset or asset group. If the useful life is shorter than originally estimated, the Company amortizes the remaining carrying value over the new shorter useful life. For the year ended December 31, 2022, the Company recognized an Operating lease right-of-use asset impairment of $1.5 million recorded in General and administrative expenses in the accompanying Consolidated Statements of Operations and Comprehensive Income. There were no impairments recognized for the years ended December 31, 2021 and 2020.

Debt Issuance Costs

The New Revolving Credit Facility, as defined in Footnote 9, Long-term Debt, includes debt issuance costs that meet the definition of an asset and are recorded in the Consolidated Balances Sheets in Other Non-Current Assets. Debt issuance costs for the New Revolving Credit Facility are amortized to interest expense over the contractual term of the underlying debt instrument on a straight-line basis through the maturity date of the instrument of October 1, 2025. As of December 31, 2022 and December 31, 2021, remaining debt issuance costs were $0.8 million and $1.1 million, respectively.

83

Table of Contents

Revenue Recognition

In accordance with ASU No. 2014-09, Revenue from Contracts with Customers (ASC 606), the Company recognizes revenue under the core principle to depict the transfer of control to its customers in an amount reflecting the consideration to which it expected to be entitled. In order to achieve that core principle, the Company applies the following five-step approach: (1) identify the contract with a customer, (2) identify the performance obligations in the contract, (3) determine the transaction price, (4) allocate the transaction price to the performance obligations in the contract, and (5) recognize revenue when a performance obligation is satisfied.

The Company primarily maintains agreements with each customer in the form of master service agreements and master service orders, which set out the terms of the arrangement and access to the Company’s services. The Company invoices clients monthly for the services provided during the month. Invoice payment terms are typically between 30 to 60 days.

The Company’s contracts with customers may include multiple promised services, consisting of the various impression measurement services the Company offers. For all revenue channels, the Company identifies performance obligations by evaluating whether the promised goods and services are capable of being distinct and distinct within the context of the contract at contract inception. Promised goods and services that are not distinct at contract inception are combined as one performance obligation. Once the Company identifies the performance obligations, the Company will determine the transaction price based on contractual amounts applied to the associated terms. The Company allocates the transaction price to each performance obligation based on the standalone selling price.

The major sources of revenue include Measurement (f/k/a Advertiser – direct), Activation (f/k/a Advertiser – programmatic), and Supply-side customers.

Measurement and Activation Revenue

For Measurement revenue, advertisers can purchase the Company’s services to measure the quality and performance of ads purchased directly from digital properties, including publishers and social media platforms. Advertisers are provided access to the Company’s platform through the Company’s proprietary self-service software that provides the Company’s customers with access to data on all their digital ads and enables them to make changes to their ad strategies. In these arrangements, the customer pays a fee to the Company based on the ads measured.

For Activation revenues, customers can elect to use the Company’s services for evaluating the quality of advertising inventory they are considering purchasing. Advertisers purchase the Company’s social activation solutions direct and programmatic activation solutions through Demand Side Platforms that manage ad campaign auctions and inventories on their behalf on an advertising exchange. The ability to provide the Company’s programmatic solutions to customers requires that the Company enter into product integration agreements with Demand-Side Platforms who in turn make the Company’s services available to advertisers. In these arrangements, the customer pays a fee to the Company (collected by the Demand-Side Platform) for the successful execution of the purchase of advertising inventory on an exchange.

For Measurement and Activation revenues, contracts with multiple performance obligations typically consist of services aimed at advertisers to help evaluate and ensure the success of a brand campaign by measuring authentic impressions. These services are generally delivered together as impressions are measured. For these services, each impression is distinct and has the same pattern of transfer to the customer. Revenue is recognized over time, as the Company is providing services that the customer is continuously consuming and receiving benefit from or upon completion of the service. The Company primarily considers the “right to invoice” practical expedient appropriate in the context of the Company’s contracts as this directly corresponds to the value of the Company’s performance to date. In this case, the Company’s pricing structure is (1) solely variable on the basis of the customer’s usage of the Company’s services, (2) is priced at a fixed rate per usage and (3) gives the entity the right to invoice the customer for its usage as it occurs.

Certain customers receive cash-based incentives, credits, or discounts on the pricing of products or services once specific volume thresholds have been met. For the years ended December 31, 2022 and 2021, the Company had a liability for customer incentives of $6.2 million and $3.2 million, respectively, included in Other current liabilities in the Consolidated Balance Sheets.

84

Table of Contents

Where volume-based discounts are applied retrospectively, these amounts are accounted for as variable consideration which the Company estimates based on the expected consideration to be received by the customer. For volume-based discounts applied prospectively, the Company evaluates each contract to determine if the discount represents a material right which would be recognized as a separate performance obligation. Revenue is recognized using the output method based on digital ads measured at the effective rate for which consideration is expected to be received.

Supply-Side Customer

Supply-Side Customer revenues consist of arrangements with publishers and other supply-side customers to provide them with software solutions and data analytics to enable them to maximize revenue from their digital advertising inventory. Certain arrangements include minimum guaranteed fees that reset monthly and are recognized on a straight-line basis over the access period, which is usually one to two years. For contracts that contain overages, once the minimum guaranteed amount is achieved, overages are recognized as earned over time based on a tiered pricing structure. Such revenues are recognized on an input method time-elapsed basis, as the Company is providing services that the customer is continuously consuming and receiving benefit from, and such recognition best depicts the transfer of control to the customer. Overages give rise to variable consideration that is allocated to the distinct periods to which the overage relates.

Transactions that Involve Third Parties

For transactions that involve third parties, the Company evaluates which party in the arrangement obtains control of the Company’s services (and is therefore the Company’s customer), which impacts whether the Company reports as revenue the gross amounts paid by the advertiser through the Demand-Side Platform or the net amount paid by the Company’s Demand-Side Platform partners. For certain arrangements, advertisers (“customers”) may purchase the Company’s service offering through a Demand-Side Platform that manages various ad campaign auctions and inventory on behalf of the advertisers. Customers elect to use the Company’s service of evaluating the quality of advertising inventory up for bid on an advertising exchange. The ability to provide these services to customers requires that the Company enter into product integration agreements with Demand-Side Platforms who in turn make the Company’s services available to advertisers. In these arrangements, the customer pays a fee to the Company (collected by the Demand-Side Platform) for the successful execution of the purchase of advertising inventory on an exchange. In these transactions, the Company transfers control of the Company’s services directly to the advertiser (who is the Company’s customer) and therefore revenue is recognized for the gross amount paid by the advertiser for the Company’s services. Specifically, the Company transfers control of the data that is influencing the purchasing decisions directly to the customer and the Company is primarily responsible for providing these services to the customer. That is, control of these services (or a right to these services) does not transfer to the Demand-Side Platform before they are transferred to the Company’s customers. Further, the Company has latitude in establishing the sales price with those customers as there is a fixed retail rate card that is included in the product integration agreements with the Demand-Side Platforms or are governed by contracts in place with the customers. Accordingly, the Company records revenue for the gross amounts paid by advertisers for these services and records the amounts retained by the Demand-Side Platforms as a cost of revenue.

Contract assets relate to the Company’s conditional right to consideration for completed performance under the contract (e.g., unbilled receivables) and are included in Trade receivables, net of allowance for doubtful accounts.

Costs to Fulfill or Obtain a Contract

The Company recognizes direct fulfillment costs as an expense when incurred. These costs include commission programs to compensate employees for generating sales orders under the Company’s master services agreements or integration agreements, and are included in Sales, marketing, and customer support. The Company has not incurred incremental costs to obtain contracts during the periods ended December 31, 2022, 2021, and 2020, respectively.

85

Table of Contents

Operating Expenses

Cost of revenue includes platform hosting fees, data center costs, software and other technology expenses and other costs directly associated with data infrastructure. Cost of revenue also includes personnel costs including salaries, bonuses, stock-based compensation, employee benefit costs, commissions related to revenue share arrangements with Demand-Side Platforms, and allocated overhead expenses for personnel who provide the Company’s customers with support in implementing and using the Company’s software platform. Cost of revenues excludes depreciation and amortization.

Product development expenses consist primarily of personnel costs, including salaries, bonuses, stock-based compensation, employee benefits costs, and allocated overhead expenses inclusive of engineering, product and technical operation expenses, third-party consultant costs associated with the ongoing research, development and maintenance of the Company’s software platform. Technology and development costs are expensed as incurred, except to the extent that such costs are associated with software development that qualifies for capitalization, which are then recorded as capitalized software and included in Property, Plant and Equipment, Net on the Company’s Consolidated Balance Sheets.

Sales, marketing and customer support expenses consist primarily of personnel costs, including salaries, bonuses, stock-based compensation, employee benefits costs, commission costs, and allocated overhead expenses for the Company’s sales, marketing and customer support personnel. Sales, marketing, and customer support expense also include costs for market development programs, advertising costs, attendance at events and trade shows, promotional and other marketing activities. Advertising costs include expenses associated with direct marketing but exclude the costs of attendance at events and trade shows. Advertising costs were $0.1 million for the years ended December 31, 2022 and 2021, and less than $0.1 million for the year ended December 31, 2020. Commissions costs are expensed as incurred.

General and administrative expenses consist primarily of personnel costs, including salaries, bonuses, stock-based compensation, employee benefits costs and other overhead expenses associated with the Company’s executive, finance, legal, human resources, compliance, and other administrative personnel, as well as accounting, tax, and legal professional services fees, rent, bad debt expense and other overhead expense related to human resource and finance activities, as well as other corporate costs including offering costs.

For the year ended December 31, 2020, the Company recorded $0.9 million in recoveries from business interruption insurance classified in General and administrative in the Consolidated Statement of Operations and Comprehensive Income. The insurance recovery related to investigating and remediating certain information technology and cybersecurity matters that occurred in the year. There were no recoveries from business interruption insurance for the years ended December 31, 2022 and 2021, respectively.

Concentrations of Credit Risk

Financial instruments that potentially subject the Company to concentrations of credit risk consist principally of cash and cash equivalents and trade receivables. The Company maintains cash deposits with financial institutions that, from time to time, exceed applicable insurance limits. The Company reduces this risk by maintaining such deposits with high quality financial institutions that management believes are creditworthy. Cash and cash equivalents are maintained with several financial institutions domestically and internationally. The combined account balances held on deposit at each institution typically exceed Federal Deposit Insurance Corporation (“FDIC”) insurance coverage and, as a result, there is a concentration of credit risk related to amounts on deposit in excess of FDIC insurance coverage. The Company monitors this credit risk and makes adjustments to the concentrations as necessary. As of December 31, 2022 and 2021, the Company had total domestic cash deposits and cash equivalents of $256.7 million and $213.6 million, respectively. Total domestic cash deposits exceeded the FDIC insurance coverage amounts.

With respect to accounts receivable, credit risk is mitigated by the Company’s ongoing credit evaluation of its customers’ financial condition. No single customer accounted for more than 10 percent of trade receivables for the years ended December 31, 2022 and 2021. With respect to revenues, no single customer accounted for more than 10% of revenues for the years ended December 31, 2022, 2021 and 2020.

86

Table of Contents

Other Income, Net

Other income, net primarily consists of interest income, change in fair value associated with contingent consideration, and the impact of foreign currency transaction gains and losses associated with monetary assets and liabilities.

Interest income consists of interest earned on interest-bearing cash bank accounts. Interest income was $2.3 million for the year ended December 31, 2022 and less than $0.1 million for the years ended December 31, 2021 and 2020.

Income Taxes

Income taxes are accounted for using the asset and liability method. Deferred income taxes are provided for temporary differences in recognizing certain income, expense and credit items for financial reporting purposes and tax reporting purposes. Such deferred income taxes primarily relate to the difference between the tax bases of assets and liabilities and their financial reporting amounts. Deferred tax assets and liabilities are measured by applying enacted statutory tax rates applicable to the future years in which deferred tax assets or liabilities are expected to be settled or realized. Excess tax benefits and tax deficiencies are recognized in the income tax provision in the period in which they occur.

The Company records a valuation allowance when it determines, based on available positive and negative evidence, that it is more-likely-than-not that some portion or all of its deferred tax assets will not be realized. The Company determines the realizability of its deferred tax assets primarily based on the reversal of existing taxable temporary differences and projections of future taxable income (exclusive of reversing temporary differences and carryforwards). In evaluating such projections, the Company considers its history of profitability, the competitive environment, and general economic conditions. In addition, the Company considers the time frame over which it would take to utilize the deferred tax assets prior to their expiration.

For uncertain tax positions, the Company uses a more-likely-than-not threshold based on the technical merits of the tax position taken. Tax positions that meet the more-likely-than-not recognition threshold are measured at the largest amount of tax benefits determined on a cumulative probability basis, which are more-likely-than-not to be realized upon ultimate settlement in the financial statements. The Company’s policy is to recognize interest and penalties related to income tax matters in income tax expense.

Stock-Based Compensation

The Company accounts for stock-based compensation awards issued to its employees and members of its Board of Directors (the “Board”) in accordance with ASC 718, Compensation—Stock Compensation. ASC 718 requires that the cost resulting from all share-based payment transactions be recognized in the financial statements. This statement establishes fair value as the measurement objective in accounting for share-based payment arrangements and requires all entities to apply a fair value-based measurement method in accounting for these transactions with employees.

87

Table of Contents

Stock-based compensation is measured at grant date based on the estimated fair value of the award and is expensed on a straight-line basis over the requisite service period net of an estimated forfeiture rate. The Company uses historical data to estimate forfeitures. The Company’s stock-based compensation awards relate to restricted stock units, stock options and awards granted under the Company’s employee stock purchase plan (“ESPP”). The fair value of restricted stock unit awards is determined on the grant date based on the grant date stock price or a Monte Carlo Simulation model in instances where a market condition exists. For share-based awards that vest subject to the satisfaction of a market condition, the fair value measurement date for stock-based compensation is the date of the grant and the expense is recognized using the accelerated attribution method over the derived service period or upon achievement of the market condition. The fair value of stock option awards and ESPP is determined on the grant date using the Black-Scholes Merton option pricing model. The option-pricing model requires a number of assumptions, of which the most significant are the expected stock price volatility, the expected option term, the risk-free interest rate, and the fair market value of the Company’s common stock. Since there is no extensive history for the Company’s public common stock, the Company bases its estimates of expected volatility on the median historical volatility of a group of publicly traded companies it believes are comparable to the Company, and uses the average of i) the weighted average vesting period and ii) the contractual life of the option, calculated using the “simplified method”. The simplified method allows for estimating the expected life based on an average of the option vesting term and option life, provided that all options meet certain criteria of “plain vanilla” options. The risk-free interest rate is based on the yield from U.S. treasury bonds as of the expected term. Additionally, the Company has assumed that dividends will not be paid.

Certain grants of stock options to executives contain certain vesting conditions, whereby, subject to the option holders continued employment with the Company, the award will vest upon the date Providence has received cumulative cash proceeds in respect of its investment in the Company equal to two times its aggregate cash investment in the Company. This is a market condition, but the requirement that the award vest on the basis of sufficient proceeds distributed to Providence represents a performance condition. Prior to the year ended December 31, 2021, the outcome of that performance condition was not considered probable, and therefore the Company did not recognize any expense associated with these stock options. During the year ended December 31, 2021, all outstanding performance conditions were achieved and the underlying stock options vested. The Company recorded expense associated with these stock options described in Footnote 13, Stock-Based Compensation.

A certain grant of restricted stock units to an executive contains certain vesting conditions, whereby, subject to the award holders continued employment with the Company, the award will vest upon the date the Company’s achieves a certain fair market value for its common stock share price. The estimated fair value of the award was determined using a Monte Carlo Simulation model in accordance with ASC 718. During the year ended December 31, 2020, the market condition was satisfied; therefore, the Company recognized stock-based compensation expense of $0.7 million associated with these restricted stock units in General and administrative expense in the Consolidated Statements of Operations and Comprehensive Income.

Earnings Per Share

Basic and diluted earnings per share (“EPS”) are determined in accordance with ASC 260, Earnings per Share. Basic EPS is calculated by dividing net income by the weighted average number of common stock outstanding during the period. Diluted EPS is based upon the weighted average number of outstanding shares of common stock and dilutive common stock equivalents in the period. Common stock equivalents arise from dilutive stock options and restricted stock units and are computed using the treasury stock method. Anti-dilutive common stock equivalents are excluded from diluted EPS.

Emerging Growth Company Status

The Company was an emerging growth company, as defined in the JOBS Act for the years ended December 31, 2021 and 2020. Under the JOBS Act, emerging growth companies can delay adopting new or revised accounting standards issued subsequent to the enactment of the JOBS Act until such time as those standards apply to private companies. The Company elected to use this extended transition period for complying with certain new or revised accounting standards during the years ended December 31, 2021 and 2020.

88

Table of Contents

As a result, the Company’s financial statements for periods prior to and during which it was an emerging growth company may not be comparable to companies that comply with new or revised accounting pronouncements as of public company effective dates.

The Company no longer meets the requirement of being an emerging growth company and has filed its Annual Report on Form 10-K for the fiscal year ended December 31, 2022 as a large accelerated filer.

Offering Costs

Offering costs consist of expenses incurred during the Company’s preparation of its IPO. These expenses include registration fees, filing fees, specific legal and accounting fees which are directly related to the Company’s efforts to raise capital through an IPO. The Company expenses offering costs as they are incurred. For the year ended December 31, 2022 there were no offering costs. For the years ended December 31, 2021 and 2020, offering costs were $22.1 million and $3.6 million, respectively, and recorded in General and administrative in the Consolidated Statement of Operations and Comprehensive Income.

Recently Adopted Accounting Pronouncements

Leases

In February 2016, the FASB issued ASU No. 2016-02, Leases (“ASU No. 2016-02”). This guidance amends the existing accounting considerations and treatments for leases through the creation of Topic 842, Leases, to increase transparency and comparability among organizations by requiring the recognition of right-of-use (“ROU”) assets and lease liabilities on the balance sheet. Lessees and lessors are required to disclose qualitative and quantitative information about leasing arrangements to enable a user of the financial statements to assess the amount, timing and uncertainty of cash flows arising from such leases.

In July 2018, the FASB issued ASU No. 2018-10, Codification Improvements to Topic 842, Leases, (“ASU No. 2018-10”) to further clarify, correct and consolidate various areas previously discussed in ASU 2016-02. The FASB also issued ASU No. 2018-11, Leases: Targeted Improvements (“ASU No. 2018-11”) to provide entities another option for transition and lessors with a practical expedient. The transition option allows entities to not apply ASU No. 2016-02 in comparative periods in the financial statements in the year of adoption. The practical expedient offers an option to not separate non-lease components from the associated lease components when certain criteria are met.

The amendments in ASU No. 2016-02, ASU No. 2018-10 and ASU No. 2018-11 (collectively “ASC 842”) are effective for fiscal years beginning after December 15, 2021, for non-public entities and interim periods within fiscal years beginning after December 15, 2022, and allow for modified retrospective adoption with early adoption permitted. The Company adopted the amendments on January 1, 2022 using the modified retrospective approach and elected the transition relief package of practical expedients by applying previous accounting conclusions under ASC 840 to all leases that existed prior to the transition date. There was no impact to retained earnings upon the adoption of ASC 842. As a result of the adoption, the Company did not reassess 1) whether existing or expired contracts contain leases, 2) lease classification for any existing or expired leases, and 3) whether lease origination costs qualified as initial direct costs. The Company did not elect the practical expedient to use hindsight in determining a lease term and impairment of the ROU assets at the adoption date. Additionally, the Company did not separate lease components from non-lease components for the specified asset classes. Furthermore, the Company did not apply the recognition requirements under ASC 842 to short-term leases, generally defined as a lease term of less than one year.

The leases have remaining lease terms ranging from less than one year to seventeen years, some of which include the options to extend the leases, and some of which include the options to terminate the leases. Upon adoption, extension and termination options were not considered in the calculation of the right-of-use assets and lease liabilities as the Company determined it was not reasonably certain that it will exercise those options.

Refer to the Leases section of Footnote 2, Basis of Presentation and Summary of Significant Accounting Policies, for details on the Company’s accounting policy.

89

Table of Contents

Financial Instruments—Credit Losses

In June 2016, the FASB issued ASU No. 2016-13, Financial Instruments-Credit Losses (Topic 326): Measurement of Credit Losses on Financial Instruments (“ASU 2016-13”), which is intended to provide more decision-useful information about expected credit losses on financial instruments and other commitments to extend credit held by a reporting entity at each reporting date. ASU 2016-13 revises the impairment model to utilize an expected loss methodology in place of the currently used incurred loss methodology, which will result in more timely recognition of losses on financial instruments, including, but not limited to accounts receivable. The Company adopted this guidance effective January 1, 2022 on a modified retrospective basis, and the adoption did not result in any cumulative effect adjustment in its consolidated financial statements.

Refer to the Trade Receivables Net of Allowances for Doubtful Accounts section of Footnote 2, Basis of Presentation and Summary of Significant Accounting Policies, for details on the Company’s accounting policy in accordance with ASU 2016-13.

Simplifying the Accounting for Income Taxes

In December 2019, the FASB issued ASU No. 2019-12, Simplifying the Accounting for Income Taxes (Topic 740) (“ASU 2019-12”), which amends accounting for income taxes during interim periods and makes changes to certain income tax classifications. The new standard allows exceptions to the use of the incremental approach for intra-period tax allocation, when there is a loss from continuing operations and income or a gain from other items, and to the general methodology for calculating income taxes in an interim period, when a year-to-date loss exceeds the anticipated loss for the year. The standard also requires franchise or similar taxes partially based on income to be reported as income tax and the effects of enacted changes in tax laws or rates to be included in the annual effective tax rate computation from the date of enactment. The effective date of ASU 2019-12 is for fiscal years beginning after December 15, 2021, and interim periods within those fiscal years. Early adoption is permitted. ASU 2019-12 may be adopted either using the prospective or retrospective transition approach and could also be applied on a modified retrospective basis through a cumulative effect adjustment to retained earnings as of the beginning of the fiscal year of adoption. The Company adopted this standard on January 1, 2022. The adoption of this standard did not have a material impact on the Company's consolidated financial statements.

3. Revenue

The following table disaggregates revenue between advertiser customers, where revenue is generated based on number of ads measured for Measurement (f/k/a Advertiser – direct) or measured and purchased for Activation (f/k/a Advertiser – programmatic) and supply-side customers, where revenue is generated based on contracts with minimum guarantees or contracts that contain overages after minimum guarantees are achieved.

Disaggregated revenue by customer type is as follows:

Year Ended December 31, 

(in thousands)


2022


2021


2020

Measurement (f/k/a Advertiser - direct)

$

157,908

$

135,516

$

106,422

Activation (f/k/a Advertiser - programmatic)


251,198


167,798


116,115

Supply-side customer


43,312


29,427


21,380

Total revenue

$

452,418

$

332,741

$

243,917

Contract assets relate to the Company’s conditional right to consideration for completed performance under the contract (e.g., unbilled receivables). Trade receivables, net of allowance for doubtful accounts, include unbilled receivable balances of $52.7 million and $55.7 million as of December 31, 2022 and 2021, respectively.

For the year ended December 31, 2020, as a concession to a Demand-Side Platform partner, the Company agreed to pay $4.6 million to that partner for amounts that were incorrectly billed by the partner and remitted to the Company in the period from January 2018 through December 2019. This concession was recognized as a reduction of revenue.

90

Table of Contents

4. Business Combinations

Meetrics GmbH

On August 31, 2021, the Company acquired all of the outstanding stock of Meetrics. Meetrics was founded in 2008 in Berlin, Germany and is a European-based ad verification provider – offering comprehensive media quality measurement solutions across viewability, fraud, brand safety and suitability. The aggregate net cash purchase price was $24.3 million. This acquisition expands DoubleVerify’s international presence as substantially all of Meetrics’ customer base and business operations are based in Europe.

The following table summarizes the final fair value of assets acquired and liabilities assumed as of the acquisition date:

(in thousands)


Acquisition Date

Assets:


Cash and cash equivalents

$

1,007

Trade receivables


778

Other assets


96

Property, plant and equipment

10

Intangible assets:


Technology


2,245

Customer relationships


7,208

Trademarks

47

Non-compete agreements

71

Total intangible assets


9,571

Goodwill


15,578

Total assets acquired

$

27,040

Liabilities:


Trade payables

$

147

Other current liabilities


361

Deferred tax liability

1,233

Total liabilities assumed


1,741

Total purchase consideration

$

25,299

Cash acquired

(1,007)

Net cash purchase price

24,292

The acquired intangible assets of Meetrics will be amortized over their estimated useful lives. Based on facts and circumstances in existence as of the effective date of the acquisition, customer relationships will be amortized over fourteen years, developed technology will be amortized over four years, non-compete agreements will be amortized over two years, and trademarks will be amortized over one year. The total weighted-average useful life of the acquired intangible assets is 11.5 years. The Company recognized a deferred tax liability of $1.2 million in relation to the intangible assets acquired.

The goodwill and identified intangible assets are not deductible for tax purposes. The Company incurred acquisition-related transaction costs of less than $0.1 million and $0.9 million included in General and administrative expenses in the Consolidated Statement of Operations and Comprehensive Income for the years ended December 31, 2022 and 2021, respectively.

The goodwill associated with Meetrics includes the acquired assembled work force, the value associated with the opportunity to leverage the work force to continue to develop the future generations of verification technology assets, as well as the ability to grow the Company through adding additional customer relationships or new solutions in the future.

The acquisition of Meetrics was immaterial to the Company's Consolidated Financial Statements for the year ended December 31, 2021, and therefore, supplemental information disclosure on an unaudited pro forma basis is not presented.

91

Table of Contents

OpenSlate

On November 22, 2021, the Company acquired OpenSlate, a leading independent pre-campaign contextual targeting platform for social video and CTV. OpenSlate’s technology provides insight into the nature and quality of ad-supported content on large, video-driven social platforms, such as Facebook, TikTok and YouTube.

The following table summarizes the components of purchase price that constitutes the consideration transferred:

(in thousands)


Cash, net of cash acquired

$

125,708

Common stock transferred


22,526

Total

$

148,234

The fair value of the Company’s common stock issued (684 shares of common stock) as consideration transferred was determined on the basis of market prices of our common stock available on November 22, 2021, the trading day on the acquisition date.

The following table summarizes the final fair value of assets acquired and liabilities assumed as of the acquisition date:

(in thousands)


Acquisition Date

Assets:

Cash and cash equivalents

$

8,549

Trade receivables


5,460

Prepaid expenses


66

Escrow assets

2,000

Other assets

167

Property, plant and equipment


Intangible assets:


Technology


11,900

Customer relationships


37,100

Total intangible assets


49,000

Goodwill


103,938

Total assets acquired

$

169,180

Liabilities:


Trade payables

$

226

Other current liabilities


2,373

Escrow liabilities

2,000

Deferred tax liability


7,798

Total liabilities assumed


12,397

Total purchase consideration

$

156,783

Cash acquired

(8,549)

Net cash purchase price

148,234

The acquired intangible assets of OpenSlate are amortized over their estimated useful lives. Based on facts and circumstances in existence as of the effective date of the acquisition, the useful life of developed technology and customer relationships intangible assets acquired were determined to be five and ten years, respectively. The total weighted-average useful life of the acquired intangible assets is 8.8 years. The Company recognized a deferred tax liability of $7.8 million in relation to the intangible assets acquired, of which $2.3 million was recognized during the three months ended December 31, 2022 upon the completion of Company’s deferred tax liability assessment for OpenSlate within the measurement period.

The goodwill and identified intangible assets are not deductible for tax purposes. The Company incurred acquisition-related transaction costs of $0.2 million and $2.2 million included in General and administrative expenses in the Consolidated Statement of Operations and Comprehensive Income for the years ended December 31, 2022 and 2021, respectively.

92

Table of Contents

The goodwill associated with OpenSlate includes the acquired assembled work force, the value associated with the opportunity to leverage the work force to continue to develop the future generations of verification technology assets, as well as the ability to grow the Company through adding additional customer relationships or new solutions in the future.

The acquisition of OpenSlate was immaterial to the Company's Consolidated Financial Statements for the year ended December 31, 2021, and therefore, supplemental information disclosure on an unaudited pro forma basis is not presented.

Zentrick NV

On February 15, 2019, the Company acquired all of the outstanding stock of Zentrick NV (“Zentrick”). Zentrick, headquartered in Ghent, Belgium is a digital video technology company that provides middleware solutions that increase the performance of online video advertising for brand advertisers, advertising platforms and publishers. This acquisition integrates technology into the Company’s suite of products related to advertising viewability specifically on video formats, a growing segment of the advertising market and critical for the delivery of verification services to social platforms and CTV. The aggregate purchase price consists of 1) $23.2 million paid in cash at closing, which excluded closing adjustments of approximately $0.2 million paid in April 2019 2) $0.1 million in holdback payment of which 50% was payable 12 months after the closing date, and the remaining 50% was payable 24 months after the closing date and 3) up to $17.3 million of performance-based deferred payments that comprises two components (the “Zentrick Deferred Payment Terms”). The first component has a $4.0 million maximum payment related to four milestone tranches of $1.0 million each based on achievement of certain product milestones (“technical milestones”). The second component has a total maximum payment of $13.0 million and varies based upon certain revenue targets in fiscal 2019, 2020, and 2021 (“revenue targets”).

Under the Zentrick Deferred Payment Terms, a portion of the technical milestones and revenue targets have been accounted at fair value as contingent consideration in the business combination with the remaining portion being accounted for as compensation expense under ASC 710, Compensation - General.

For the year ended December 31 2022, there was no contingent consideration recorded in the Consolidated Balance Sheets. For the year ended December 31, 2021, contingent consideration had a fair value of $1.7 million and is recorded in Contingent Consideration Current in the Consolidated Balance Sheets. There was no change in the fair value in the Consolidated Statement of Operations and Comprehensive Income for the year ended December 31, 2022. The change in fair value in the Consolidated Statement of Operations and Comprehensive Income for the years ended December 31, 2021 and 2020 was an unrealized loss of $0.1 million and an unrealized gain of $0.9 million, respectively.

For the year ended December 31, 2022, no components were treated as compensation cost. For the year ended December 31, 2021, the components treated as compensation cost total $1.1 million and is included in Other Current Liabilities in the Consolidated Balance Sheets. For the year ended December 31, 2022, there was no charge to the Consolidated Statements of Operations and Comprehensive Income. For the years ended December 31, 2021 and 2020, less than $0.1 million and $0.2 million were charged to the Consolidated Statements of Operations and Comprehensive Income, respectively.

The Company and the Zentrick selling stockholders reached an agreement for the early termination of the Zentrick Deferred Payment Terms and resolution of the contingent payments due for both the technical milestones and revenue targets. On February 16, 2022, pursuant to the terms of the Zentrick Early Termination Agreement, the Company made a payment of $5.6 million to the Zentrick selling stockholders and recorded $2.8 million of additional expense in General and administrative expense in the Consolidated Statement of Operations and Comprehensive Income and is included in Other Current Liabilities in the Consolidated Balance Sheets as this amount was deemed probable as of December 31, 2021.

93

Table of Contents

5. Goodwill and Intangible Assets

The following is a summary of changes to the goodwill carrying value from December 31, 2020 through December 31, 2022:

(in thousands)

Goodwill as of December 31, 2020


$

227,349

Business combinations (Meetrics and OpenSlate)

124,179

Foreign exchange impact and other


(968)

Goodwill as of December 31, 2021

$

350,560

Measurement period adjustments

(4,660)

Foreign exchange impact

(2,889)

Goodwill as of December 31, 2022

$

343,011

The following table summarizes the Company’s intangible assets and related accumulated amortization:

December 31, 2022

December 31, 2021

Gross 

Net

Gross 

Net

Carrying

Accumulated 

Carrying

Carrying

Accumulated 

Carrying

(in thousands)


Amount


Amortization


Amount


Amount


Amortization


Amount

Trademarks and brands

$

11,733

$

(4,294)

$

7,439

$

11,735

$

(3,422)

$

8,313

Customer relationships

145,834

(49,587)

96,247

143,728

(36,831)

106,897

Developed technology

76,677

(44,956)

31,721

72,065

(33,937)

38,128

Non-compete agreements

64

(42)

22

68

(11)

57

Total intangible assets

$

234,308

$

(98,879)

$

135,429

$

227,596

$

(74,201)

$

153,395

Amortization expense related to intangible assets amounted to $25.1 million, $18.8 million, and $17.9 million for the years ended December 31, 2022, 2021 and 2020, respectively.

Estimated future expected amortization expense of intangible assets as of December 31, 2022, is as follows:

(in thousands)


2023

$

24,792

2024


23,296

2025


21,168

2026

16,076

2027


13,866

2028 and thereafter


36,231

Total

$

135,429

The weighted-average remaining useful life by major asset classes as of December 31, 2022 is as follows:


(In years)

Trademarks and brands

9

Customer relationships

8

Developed technology


3

Non-compete agreements


1

There were no impairments identified during the years ended December 31, 2022, 2021 and 2020.

94

Table of Contents

6. Property, Plant and Equipment, net

Property, plant and equipment, net, including equipment under finance lease obligations and capitalized software development costs, consists of the following:

As of December 31, 

(in thousands)


2022


2021

Computers and peripheral equipment

$

19,189

$

18,883

Office furniture and equipment


2,542


1,102

Leasehold improvements


29,678


9,354

Capitalized software development costs


22,026


15,007

Less accumulated depreciation and amortization


(26,401)


(26,771)

Total property, plant and equipment, net

$

47,034

$

17,575

For the years ended December 31, 2022, 2021 and 2020 total depreciation expense was $9.2 million, $11.5 million and $6.7 million, respectively.

Property and equipment under finance lease obligations, consisting of computer equipment, totaled $12.3 million as of December 31, 2022 and 2021. As of December 31, 2022 and 2021, accumulated depreciation related to property and equipment under finance lease obligations totaled $11.2 million and $10.0 million, respectively, refer to Footnote 7, Leases.

During the year ended December 31, 2022, the Company disposed of certain office furniture, equipment and leasehold improvements resulting in a loss on disposal of $1.4 million. The fixed asset disposals relate primarily to the transfer of fixed assets in a sublease office arrangement and the abandonment of fixed assets no longer in use. The loss on disposal was recorded in General and administrative expenses in the accompanying Consolidated Statements of Operations and Comprehensive Income.

7. Leases

The following table presents the cumulative effect of the changes made to the Consolidated Balance Sheet as of January 1, 2022 as a result of the adoption of ASC 842:

(in thousands)

December 31, 2021

Adjustments due to ASC 842

January 1, 2022

Prepaid expenses and other current assets

$

23,295

$

(229)

$

23,066

Other non-current assets

$

2,780

$

(496)

$

2,284

Operating lease right-of-use assets, net

$

$

78,827

$

78,827

Operating lease liabilities, current

$

$

4,885

$

4,885

Operating lease liabilities, non-current

$

$

74,677

$

74,677

Other current liabilities

$

6,716

$

(614)

$

6,102

Other non-current liabilities

$

3,209

$

(847)

$

2,362

95

Table of Contents

The following table presents lease cost, cash paid for amounts included in the measurement of lease liabilities, weighted-average remaining lease terms, and weighted-average discount rates for finance and operating leases for the year ended December 31, 2022.


Year Ended

(in thousands)

December 31, 2022

Lease cost:

Operating lease cost (1)

$

10,922

Finance lease cost

Depreciation of finance lease assets (2)

1,191

Interest on finance lease liabilities (3)

139

Short-term lease cost (1)

1,080

Sublease income (1)

(622)

Total lease cost

$

12,710


Other information:

Cash paid for amounts included in the measurement of lease liabilities

Operating cash outflows from operating leases

$

5,367

Operating cash outflows from finance leases

$

132

Financing cash outflows from finance leases

$

1,924

(1)Included in Cost of revenue, Sales, marketing and customer support, Product development and General and administrative expenses in the accompanying Consolidated Statements of Operations and Comprehensive Income.
(2)Included in Depreciation and amortization in the accompanying Consolidated Statements of Operations and Comprehensive Income.
(3)Included in Interest expense in the accompanying Consolidated Statements of Operations and Comprehensive Income.

The following table presents weighted-average remaining lease terms and weighted-average discount rates for finance and operating leases as of December 31, 2022:


December 31, 2022

Weighted-average remaining lease term - operating leases (in years)


14.2

Weighted-average remaining lease term - finance leases (in years)


1.6

Weighted-average discount rate - operating leases

4.5%

Weighted-average discount rate - finance leases


3.7%

Maturities of lease liabilities as of December 31, 2022 are as follows:


December 31, 2022

(in thousands)

Operating Leases

Finance Leases

2023

$

7,169

$

1,937

2024


7,944


598

2025


7,104


168

2026


6,463


2027


6,336


2028 and thereafter

80,610

Total lease payments


115,626


2,703

Less amount representing interest


(34,499)


(78)

Present value of total lease payments

$

81,127

$

2,625

96

Table of Contents

The Company entered into an agreement to sublease its leased office space located in New York, NY (“Sublease Transaction”) as the Company transitioned into a new headquarters. The sublease triggered an Operating lease right-of-use asset impairment of $1.5 million recorded in General and administrative expenses in the accompanying Consolidated Statements of Operations and Comprehensive Income. The fair value of the Operating lease right-of-use asset was determined as of May 27, 2022 using the transaction price per the Sublease Transaction executed agreement. The fair value measurement represents a Level 1 input.

ASC 840 Comparative Disclosures

The following tables, which were included in our Annual Report on Form 10-K for the fiscal year ended December 31, 2021, present the Company’s future minimum lease payments under ASC 840 for all operating leases as of December 31, 2021. Future minimum lease payments differ from the future lease liability recognized under ASC 842, as the operating lease liability recognized under ASC 842 discounts the lease payments while the minimum operating lease payments presented below are not discounted.

Operating Leases

Year Ending

(in thousands)


December 31, 

2022

$

5,463

2023


4,381

2024


681

2025


439

2026

294

Thereafter

76

$

11,334

Commitments

On November 29, 2021, the Company entered into a non-cancellable contractual agreement to lease office space in New York, New York. The lease term for this office space commenced in January 2022 and will end in July 2038. The Company moved into the property in the fourth quarter of 2022. The office space is now DoubleVerify’s new corporate headquarters.

Year Ending

(in thousands)


December 31, 

2022

$

2023


1,735

2024


5,987

2025


6,077

2026

6,168

Thereafter

86,872

$

106,839

97

Table of Contents

8. Fair Value Measurement

The following tables present the Company’s financial instruments that are measured at fair value on a recurring basis:

As of December 31, 2022

Quoted Market

Prices in Active

Significant

Markets for

Significant Other

Unobservable

Identical Assets

Observable Inputs

 Inputs

Total Fair Value 

(in thousands)


(Level 1)


(Level 2)


(Level 3)


Measurements

Assets:


Cash equivalents:

$

11,710

$

$

$

11,710

Liabilities:


Contingent consideration current


Contingent consideration non‑current


Contingent consideration

$

$

$

$

As of December 31, 2021

Quoted Market

Prices in Active

Significant 

Markets for

Significant Other

Unobservable

Identical Assets

Observable Inputs

 Inputs

Total Fair Value 

(in thousands)


(Level 1)


(Level 2)


(Level 3)


Measurements

Assets:


Cash equivalents:

$

12,324

$

$

$

12,324

Liabilities:


Contingent consideration current


1,717


1,717

Contingent consideration non‑current


Contingent consideration

$

$

$

1,717

$

1,717

Cash equivalents, consisting of money market funds of $11.7 million and money market funds and time deposits of $12.3 million as of December 31, 2022 and December 31, 2021, respectively, were classified as Level 1 of the fair value hierarchy and valued using quoted market prices in active markets.

Contingent consideration relates to potential payments that the Company may be required to make associated with a business combination. To the extent that the valuations of these liabilities are based on inputs that are less observable or not observable in the market, the determination of fair value requires more judgment. Accordingly, the degree of judgment exercised in determining fair value is greatest for measures categorized in Level 3.

Rollforward of the fair value measurements of the contingent consideration categorized with Level 3 inputs for the years ended December 31, 2022, 2021, and 2020 is as follows:

(in thousands)


Balance as of January 1, 2020

$

3,210

Fair value adjustments

(949)

Payments during the year

(601)

Balance as of December 31, 2020


$

1,660

Fair value adjustments


57

Balance as of December 31, 2021

$

1,717

Payments during the year


(1,717)

Balance as of December 31, 2022

$

98

Table of Contents

Prior to the early termination of the Zentrick Deferred Payment Terms described in Footnote 4, Business Combinations, the fair value of the component of contingent consideration related to achievement of revenue targets have been estimated using a Monte Carlo model to simulate future performance of the acquired business under a risk-neutral framework; significant assumptions include a risk-adjusted discount rate of 13.5% and revenue volatility of 29.0% for December 31, 2021 and a risk-adjusted discount rate of 12.7% and revenue volatility of 30.0% for December 31, 2020. The fair value of the component of contingent consideration related to achievement of four technical milestones have been estimated using situation-based modeling, which considers the probability-weighted present value of the expected payout amount.

As described in Footnote 4, Business Combinations, on February 16, 2022, pursuant to the terms of the Zentrick Early Termination Agreement, the Company paid the remaining balance of the contingent consideration referred to as the Zentrick Deferred Payment Terms.

There was no new contingent consideration in the year ended December 31, 2022.

9. Long-term Debt

On October 1, 2020, DoubleVerify Inc., as borrower (the “Borrower”), and MidCo, as guarantor, entered into an amendment and restatement agreement with the banks and other financial institutions party thereto, as lenders, and Capital One, National Association, as administrative agent, letter of credit issuer and swing lender, and others, to (i) amend and restate the Company’s Prior Credit Agreement as defined in the Prospectus (the Prior Credit Agreement, as amended and restated on October 1, 2020, the “Credit Agreement”) and (ii) replace the Company’s Prior Credit Facilities (as defined in the Prospectus) with a new senior secured revolving credit facility (the “New Revolving Credit Facility”) in an aggregate principal amount of $150.0 million (with a letter of credit facility of up to $15.0 million as a sublimit). Subject to certain terms and conditions, the Borrower is entitled to request additional term loan facilities or increases in the revolving credit commitments under the New Revolving Credit Facility. The New Revolving Credit Facility is payable in quarterly installments for interest, with the principal balance due in full at maturity on October 1, 2025. Additional fees paid quarterly include fees for the unused revolving facility and unused letter of credit. The commitment fee on any unused balance is payable periodically and may range from 0.25% to 0.40% based upon the Borrower’s total net leverage ratio calculated in accordance with the Credit Agreement. The New Revolving Credit Facility bears interest at LIBOR plus 2.25%, which may vary from time to time based on the Borrower’s total net leverage ratio calculated in accordance with the Credit Agreement.

The New Revolving Credit Facility contains a number of significant negative covenants. Subject to certain exceptions, these covenants require the Borrower to comply with certain requirements and restrictions on its ability to, among other things: incur indebtedness; create liens; engage in mergers or consolidations; make investments, loans and advances; pay dividends or other distributions and repurchase capital stock; sell assets; engage in certain transactions with affiliates; enter into sale and leaseback transactions; and make certain accounting changes. As a result of these restrictions, substantially all of the net assets of the Borrower are restricted from distribution to the Company or any holders of its equity.

The New Revolving Credit Facility has a first priority lien on substantially all of the assets of MidCo, the Borrower and Ad-Juster, the Company’s indirect subsidiary. The New Revolving Credit Facility requires the Borrower to remain in compliance with a maximum total net leverage ratio and a minimum fixed charge coverage ratio, each as defined in the Credit Agreement.

As of December 31, 2022, the maximum total net leverage ratio and minimum fixed charge coverage ratio is 3.5x and 1.25x, respectively. The Borrower is in compliance with all covenants under the New Revolving Credit Facility as of December 31, 2022.

As of December 31, 2022 and December 31, 2021, there was no outstanding debt under the New Revolving Credit Facility.

99

Table of Contents

10. Income Tax

The components of income before income tax provision (benefit) are as follows:

Year Ended December 31, 

(in thousands)


2022


2021


2020

Domestic

$

54,162

$

16,499

$

10,017

Foreign


5,206


9,322


7,292

Income before income taxes

$

59,368

$

25,821

$

17,309

Income tax provision (benefit) is as follows:

Year Ended December 31, 

(in thousands)


2022


2021


2020

Current


Federal

$

20,599

$

821

$

176

State


14,435


1,508


636

Foreign


711


1,999


1,181

Total current tax provision

$

35,745

$

4,328

$

1,993

Deferred


Federal

$

(15,467)

$

(5,545)

$

(3,608)

State


(4,324)


(2,241)


(1,542)

Foreign


146


(29)


13

Total deferred tax benefit

$

(19,645)

$

(7,815)

$

(5,137)

Income tax provision (benefit)

$

16,100

$

(3,487)

$

(3,144)

A reconciliation of the statutory U.S. income tax rate to the effective income tax rate is as follows:

Year Ended December 31, 


2022


2021


2020


Statutory federal tax rate


21.0

%  

21.0

%

21.0

%

State taxes


9.7

(3.3)

(7.5)

Tax credits


(5.6)

(3.9)

(7.3)

Foreign taxes


0.2

(1.8)

Non‑deductible items and other


1.5

(0.6)

(2.4)

Change in valuation allowance


2.3

Changes in tax reserves


1.7

1.9

8.6

Provision to return adjustment


(1.2)

0.5

(13.5)

Transaction costs

18.9

Global Intangible Low Tax Income


1.0

0.7

1.1

Non-deductible officers' compensation

2.7

47.8

Non‑cash compensation


(3.9)

(96.5)

(18.7)

Effective tax rate


27.1

%  

(13.5)

%  

(18.2)

%

100

Table of Contents

Income Tax Provision (Benefit)

The Company’s effective tax rate for the year ended December 31, 2022 was higher than the U.S. federal statutory income tax rate primarily due to the impact of state and foreign taxes and other permanent book-tax differences including non-deductible executive compensation and non-cash compensation. For the year ended December 31, 2021, the Company’s effective tax rate was lower than the U.S. federal statutory income tax rate primarily due to the impact of deductible non-cash compensation, non-deductible executive compensation, IPO related costs, foreign taxes, certain tax credits, provision to return adjustments and the impact of other permanent book-tax differences. For the year ended December 31, 2020, the Company’s effective tax rate was lower than the U.S. federal statutory income tax rate primarily due to the impact of deductible non-cash compensation, certain tax credits, foreign taxes, provision to return adjustments and the impact of other permanent book-tax differences.

Deferred Income Taxes

Deferred income taxes reflect the net tax effects of temporary differences between the carrying amount of assets and liabilities for financial reporting purposes and the amounts used for income tax reporting purposes. The following table details the components of deferred tax assets and liabilities as of December 31, 2022:

As of December 31, 

(in thousands)


2022


2021

Deferred tax assets:


Allowance for doubtful accounts

$

2,338

$

1,454

Accrued expenses and other


6,299


6,025

Stock compensation

3,920

2,667

Capitalized costs

18,839

Lease liability

22,941

Net operating losses


4,117


8,120

Gross deferred tax assets


58,454


18,266

Valuation allowance


(500)


(482)

Net deferred tax assets

$

57,954

$

17,784

Deferred tax liabilities:


ROU asset

$

(18,042)

$

Purchased intangibles

(38,216)

(44,836)

Depreciation and amortization


(14,551)


(3,195)

Total deferred tax liabilities


(70,809)


(48,031)

Net deferred tax liability

$

(12,855)

$

(30,247)

The Company has not recorded a deferred tax liability for foreign withholding or other foreign local tax on the undistributed earnings from the Company’s international subsidiaries as such earnings are considered to be indefinitely reinvested.

Under the Tax Cuts and Jobs Act of 2017, research and development costs are no longer fully deductible and are required to be capitalized and amortized for U.S. tax purposes effective January 1, 2022. The mandatory capitalization requirement increases our deferred tax assets and cash tax liabilities.

On August 16, 2022, the U.S. government enacted the Inflation Reduction Act which, among other changes, imposes a 15% corporate alternative minimum tax (“CAMT”) and a 1% excise tax on stock repurchases. Once subject to the CAMT, a taxpayer will compute both its CAMT liability and its regular federal tax liability and pay the higher of the two. To the extent that the CAMT liability exceeds the regular federal tax liability, a taxpayer will receive a credit (“CAMT credit”) which can be used against its regular federal tax liability in the future when the taxpayer is no longer subject to the CAMT. The CAMT credit does not expire. The CAMT is effective for tax years beginning after December 31, 2022, which means it will be applicable to the Company effective January 1, 2023. The excise tax on stock repurchases applies to stock repurchases occurring after December 31, 2022.

101

Table of Contents

The Company continues to evaluate the impact the CAMT will have on its financial statements but does not expect to be subject to the CAMT. However, as noted above, if in the future the Company pays CAMT it will receive a CAMT credit that can be carried forward indefinitely and applied against its regular federal tax liability in future years. Likewise, the Company continues to monitor the potential impact of the excise tax for stock repurchases occurring after December 31, 2022, but the impact to the financial statements is not expected to be material.

Tax Valuation Allowance

The Company’s deferred tax assets and liabilities are primarily comprised of purchased intangibles, book to tax differences in depreciation and amortization, book and tax differing treatment of accruals, net operating losses, and differing timing of stock compensation deductions. As of each reporting date, management considers new evidence, both positive and negative, that could impact management’s view with regard to the future realization of deferred tax assets. As of December 31, 2022, (i) the Company’s taxable temporary differences will provide sufficient US future taxable income to realize the US deferred tax assets and (ii) the Company’s projected future pre-tax book income in the US and respective foreign countries is expected to provide sufficient taxable income to realize the deferred tax assets within each jurisdiction’s respective statutory carryforward period. Based on this analysis, the Company has concluded that it is more likely than not that the Company will realize most of its US and foreign deferred taxes assets. A valuation allowance is assessed to a small amount of foreign capital losses and US tax loss carryforwards.

Net Operating Loss and Credit Carryforwards

As of December 31, 2022, the Company had a Federal net operating loss carryforward of approximately $10.0 million and a state net operating loss carryforward of approximately $14.0 million. Of these carryforwards, approximately $8.1 million of Federal net operating losses and $9.1 million of state net operating losses were acquired with the OpenSlate acquisition in 2021. In addition, the Company had loss carryforwards for various foreign countries where the Company has business operations. Of these carryforwards, as of December 31, 2022, the Company had approximately $3.6 million of German net operating losses that were acquired with the Meetrics acquisition in 2021. The remaining aggregate amount of foreign loss carryover is not significant as of December 31, 2022. Federal net operating loss carryforwards can be used to offset against taxable income in the future and begin to expire in 2031. The Company utilized approximately $11.0 million and $26.1 million of Federal and state net operating loss carryforwards, respectively, in 2022. Utilization of Federal net operating loss carryforwards may be subject to annual limitations due to the “change in ownership” provisions of the Internal Revenue Code of 1986 and similar state provisions. The Company’s net operating loss carryforwards are subject to the annual limitation under Section 382 of the Internal Revenue Code.

Uncertain Tax Positions

The Company’s income tax returns are open to examination by federal and state authorities for the tax years ended December 31, 2019 and later. However, the Company believes that its tax positions are all highly certain of being upheld upon examination and intends to defend those positions if challenged by the Internal Revenue Service or another taxing jurisdiction.

For uncertain tax positions, the Company uses a more-likely-than-not recognition threshold based on the technical merits of the tax position taken. Tax positions that meet the more-likely-than-not recognition threshold are measured as the largest amount of tax benefits determined on a cumulative probability basis, which are more-likely-than-not to be realized upon ultimate settlement in the financial statements. The Company has unrecognized tax benefits, which are tax benefits related to uncertain tax positions which have been or will be reflected in income tax filings that have not been recognized in the financial statements due to potential adjustments by taxing authorities in the applicable jurisdictions. The Company's liabilities for unrecognized tax benefits, which include interest and penalties, were $3.4 million and $2.4 million as of December 31, 2022 and 2021, respectively. The amount of unrecognized tax benefits that, if recognized, would affect the Company's effective tax rate are $3.3 million and $2.2 million as of December 31, 2022 and 2021, respectively and include the federal tax benefit of state deductions. The Company anticipates that no unrecognized tax benefits will reverse during the next year due to the expiration of statutes of limitation.

102

Table of Contents

Changes in the Company’s unrecognized tax benefits are as follows:

Year Ended December 31, 

(in thousands)


2022


2021

Beginning balance

$

2,363

$

1,879

Increase related to tax positions of prior years


432


227

Increase related to tax positions of the current year


620


257

Ending balance

$

3,415

$

2,363

11. Employee Contribution Plan

The Company has a 401(k) plan for the benefit of all U.S. employees who meet certain eligibility requirements. This plan covers substantially all of the Company’s full-time U.S. employees. The Company’s contributions costs are at the Company’s discretion and were $1.8 million, $1.4 million and $1.2 million for the years ended December 31, 2022, 2021 and 2020, respectively.

12. Earnings Per Share

The following table reconciles the numerators and denominators used in computations of the basic and diluted EPS:

Year Ended December 31, 


2022


2021


2020

Numerator:


Net Income (basic and diluted)

$

43,268

$

29,308

$

20,453

Denominator:


Weighted‑average common shares outstanding


163,882


148,309


138,072

Dilutive effect of stock based awards


6,873


11,955


7,372

Weighted‑average dilutive shares outstanding


170,755


160,264


145,443

Basic earnings per share

$

0.26

$

0.20

$

0.15

Diluted earnings per share

$

0.25

$

0.18

$

0.14

Approximately 5.1 million, 1.4 million, and 7.5 million weighted average shares issuable under stock-based awards were not included in the diluted EPS calculation for the years ended December 31, 2022, 2021 and 2020, respectively, because they were antidilutive.

13. Stock-Based Compensation

Employee Equity Incentive Plan

On September 20, 2017, the Company established its 2017 Omnibus Equity Incentive Program (the “2017 Plan”) which provides for the granting of equity based awards to certain employees, directors, independent contractors, consultants and agents. Under the 2017 Plan, the Company may grant non-qualified stock options, stock appreciation rights, restricted stock units, and other stock-based awards for up to 22,182 shares of common stock.

103

Table of Contents

On April 19, 2021, the Company established its 2021 Omnibus Equity Incentive Plan (“2021 Equity Plan”). The maximum number of shares of common stock available for issuance under the 2021 Equity Plan is equal to the sum of (i) 30,000 shares of common stock and (ii) an annual increase on the first day of each year beginning in 2022 and ending in and including 2031, equal to the lesser of (A) five percent (5%) of the outstanding shares of common stock on the last day of the immediately preceding fiscal year and (B) such lesser amount as determined by the Board’s compensation committee. The 2021 Equity Plan provides for the grant of stock options (including qualified incentive stock options and nonqualified stock options), stock appreciation rights, restricted stock, restricted stock units, dividend equivalents, and other stock or cash settled incentive awards. Any shares covered by an award, or portion of an award, granted under the 2021 Equity Plan that expires or is forfeited, canceled, cash-settled, or otherwise terminated for any reason will again be available for the grant of awards under the 2021 Equity Plan.

Options become exercisable subject to vesting schedules up to four years from the date of the grant and subject to certain timing restrictions upon an employee’s separation of service and no later than 10 years after the grant date.

Restricted stock units are subject to vesting schedules up to four years from the date of the grant and subject to certain timing restrictions upon an employee’s separation.

A summary of stock option activity as of and for the year ended December 31, 2022 is as follows:

Stock Option


Weighted 

Average 

Weighted 

Remaining 

Number of 

Average 

Contractual Life

Aggregate 


Options


Exercise Price


 (Years)


Intrinsic Value

Outstanding as of January 1, 2022


12,117

$

10.84


7.53

$

274,684

Options granted


1,715

25.50


Options exercised


(1,580)

3.74


Options forfeited


(391)

25.05


Outstanding as of December 31, 2022


11,861

$

13.43


7.17

$

129,323

Options expected to vest as of December 31, 2022


4,322

$

22.25


8.67

$

17,722

Options exercisable as of December 31, 2022


7,312

$

7.81


6.21

$

111,347

Stock options include grants to executives that contain both market-based and performance-based vesting conditions. On November 19, 2021, the Company filed a prospectus for certain selling stockholders to sell 8,000 shares of the Company’s common stock (“Secondary Offering”) pursuant to Rule 424(b)(4). The Company did not receive any proceeds from the sale of shares by the selling stockholders. Upon completion of the Secondary Offering, Providence received cumulative cash proceeds that exceeded two times its aggregate cash investment in the Company; therefore, the performance condition was achieved and the stock options tied to the performance condition vested. In connection with the vesting, the Company recorded $2.1 million in the Consolidated Statements of Operations and Comprehensive Income for the year ended December 31, 2021. For the year ended December 31, 2020, the Company did not consider the performance condition to be probable and did not recognize any expense associated with those options.

There were no stock options granted that contain both market-based and performance-based vesting conditions during the year ended December 31, 2022. During the year ended December 31, 2022, 565 stock options were exercised and 2,026 market-based and performance-based stock options remain outstanding as of December 31, 2022.

During the year ended December 31, 2020, the Company repurchased and cancelled 956 of stock options that contain both market-based and performance-based vesting conditions resulting in $14.5 million in incremental cash-based compensation expense related to the transaction.

The weighted average grant date fair value of options granted for the years ended December 31, 2022, 2021, and 2020 was $12.09, $13.01 and $2.67, respectively. The total intrinsic value of options exercised during the years ended December 31, 2022, 2021 and 2020 was $34.3 million, $141.0 million and $3.6 million, respectively.

104

Table of Contents

The fair market value of each option granted for the years presented has been estimated on the grant date using the Black-Scholes-Merton option-pricing model with the following assumptions:


2022


2021


2020

Risk‑free interest rate (percentage)


2.0 - 3.7


0.6. - 1.4


0.3 - 1.6

Expected term (years)


6.1


5.8 - 6.1


5.3 - 6.3

Expected dividend yield (percentage)


Expected volatility (percentage)


42.8 - 46.0


42.1 - 43.6


39.9 - 44.1

The Company’s board of directors (the “Board”) did not declare or pay dividends on any Company stock during the years ended December 31, 2022 and 2021.

A summary of restricted stock unit activity as of and for the year ended December 31, 2022 is as follows:

Restricted Stock

Weighted 

Average Grant 

Number of 

Date Fair 


Shares


Value

Outstanding as of January 1, 2022

3,250

$

24.20

Granted

2,060

24.75

Vested

(1,843)

19.16

Forfeited

(313)

28.46

Outstanding as of December 31, 2022


3,154

$

27.07

The total grant date fair value of restricted stock units that vested during the years ended December 31, 2022, 2021, and 2020 was $35.3 million, $4.4 million and $0.7 million, respectively.

The weighted average grant date fair value of restricted stock units granted during the years ended December 31, 2021 and 2020 was $31.22 and $7.59, respectively.

As of December 31, 2022, unrecognized stock-based compensation expense was $112.3 million, which is expected to be recognized over a weighted-average period of 1.5 years.

Total stock-based compensation expense recorded in the Consolidated Statements of Operations and Comprehensive Income as follows:

Year Ended December 31, 

(in thousands)


2022


2021


2020

Product development


15,030


4,369


673

Sales, marketing and customer support


14,265


6,375


6,151

General and administrative


13,012


11,143


13,703

Total stock‑based compensation

$

42,307

$

21,887

$

20,527

Non‑cash stock‑based compensation expense

$

42,307

$

21,887

$

5,984

Cash‑based compensation expense (a)


14,543

Total stock‑based compensation

$

42,307

$

21,887

$

20,527

(a)Includes incremental cash-based compensation paid in connection with repurchased and cancelled stock options of 956 that contain both market-based and performance-based vesting conditions.

105

Table of Contents

Employee Stock Purchase Plan

In March 2021, the Board approved the Company’s 2021 Employee Stock Purchase Plan (“ESPP”), and employees became eligible to enroll in August 2021. The ESPP qualifies as an “employee stock purchase plan” under Section 423 of the U.S. Internal Revenue Code of 1986, as amended.

The Company reserved 3,000 shares of common stock for issuance under the ESPP. The share reserve increases on the first day of each calendar year beginning on January 1, 2022 and ending on and including January 1, 2031, equal to the lesser of (i) one percent (1%) of the aggregate number of shares of common stock outstanding on the final day of the immediately preceding calendar year and (ii) such smaller number of shares of common stock as is determined by the Board.

Purchases are accomplished through participation in discrete offering periods. The ESPP is available to U.S.-based employees and was expanded to most of the Company’s non-U.S.-based employees in 2022. The current offering period began on December 1, 2022 and will end on May 31, 2023. The Company expects the program to continue consecutively for six-month offering periods for the foreseeable future.

Under the ESPP, eligible employees are able to acquire shares of the Company’s common stock by accumulating funds through payroll deductions. Company employees in the United States generally are eligible to participate in the ESPP if they are a full-time employee and have completed six months of continuous service with the Company as of the last day of the enrollment period. Eligible employees are able to select a rate of payroll deduction between 1% and 15% of their eligible compensation, up to a $25 annual contribution limit. The purchase price for shares of common stock purchased under the ESPP is 85% of the lesser of the fair market value of the common stock on (i) the first trading day of the applicable offering period and (ii) the last trading day of the applicable offering period. Employees are required to hold shares purchased for minimum of six months following the purchase date. An employee’s participation automatically ends upon termination of employment for any reason. A participant may cancel enrollment or lower their contributions once during an offering period, but no later than 30 days before the end of an offering period. Upon the termination of an employee’s participation in the ESPP, payroll deductions will be stopped and refunded.

Stock-based compensation expense for the ESPP is recognized on a straight-line basis over the requisite service period of each award. Stock-based compensation expense related to ESPP totaled $0.6 million and $0.1 million for years ended December 31, 2022 and 2021, respectively.

14. Stockholders’ Equity

On October 27, 2020, the Company entered into a Series A Preferred Stock Purchase Agreement (“Preferred Purchase Agreement) pursuant to which an investor group, led by Tiger Global Management, purchased 61,006 shares of Series A Preferred Stock (“preferred stock”) from the Company and certain of its existing stockholders for an aggregate purchase price of approximately $350.0 million. The preferred stock consisted of 15,568 shares issued and sold by the Company to the new investors, raising approximately $89.3 million in cash before transaction costs. 45,438 shares of common stock (prior to giving effect to the reverse stock split) held by existing shareholders were exchanged on a 1:1 basis for newly issued shares of preferred stock and then sold to the new investors. All cash received related to the exchange was transferred to selling shareholders. The Company recorded the exchange of common stock for preferred stock as Treasury Stock at cost in the Consolidated Balance Sheets. The preferred stock issued in the transaction were non-participating, not redeemable, had no declared dividends and contained a liquidation preference. The liquidation preference allowed for holders of shares of preferred stock then outstanding to be entitled to be paid out before any payments to holders of the Company’s common stock up to the preferred stock issuance price plus any dividends declared but unpaid.

On April 9, 2021, the Company entered into an arrangement with an affiliate of Tiger Investor whereby the Tiger Investor purchased $30.0 million of the Company’s common stock in a private placement (‘‘concurrent private placement’’) concurrent with the completion of the IPO. The price per share was equal to the IPO price of $27.00, for a total of 1,111 shares. The Company received total aggregate net proceeds of $29.0 million, after deducting underwriting fees of $1.0 million.

106

Table of Contents

On April 23, 2021, the Company completed its IPO in which the Company issued and sold 9,977 shares of common stock at a public offering price of $27.00 per share, which included the full exercise of the underwriters’ option to purchase 1,350 additional shares of common stock. The Company received aggregate net proceeds of $253.2 million from the IPO, after deducting underwriting discount fees of $16.2 million. The Company incurred offering costs of approximately $27.1 million for the concurrent private placement and IPO, of which $22.1 million and $3.6 million were included in General and administrative expenses in the Consolidated Statement of Operations and Comprehensive Income for the years ended December 31, 2021 and 2020, respectively. The IPO offering also included 5,356 shares sold by Providence VII U.S. Holdings L.P. (“Providence”) and other existing stockholders, which included the full exercise of the underwriters’ option to purchase 650 additional shares from Providence, in which the Company did not receive any proceeds from the shares sold.

In connection with the Company’s IPO, all shares of the Company’s outstanding preferred stock automatically converted into 20,335 shares of common stock on a one for one-third basis. The Company’s treasury stock, consisting of 15,146 shares of common stock, was reissued in the preferred stock conversion.

In conjunction with the IPO, the Company increased the authorized shares of its capital stock. The Company’s capital stock consists of 1,000,000 shares of common stock, par value $0.001 per share and 100,000 shares of undesignated preferred stock, par value $0.01 per share.

15. Commitments and Contingencies

Accrued Expense

Accrued expenses as of December 31, 2022 and December 31, 2021 were as follows:

As of December 31, 

(in thousands)


2022


2021

Vendor payments

$

4,824

$

3,639

Employee commissions and bonuses


17,718


13,324

Payroll and other employee related expense


7,024


18,879

401k and pension expense


2,144


1,775

Other taxes


1,375


1,026

Other costs (a)

2,813

Total accrued expense

$

33,085

$

41,456

(a)Includes accrued expense related to the early termination of the Zentrick Deferred Payment Terms, as described in Footnote 4, Business Combinations.

Contingencies

Litigation

From time to time, the Company is subject to various legal proceedings and claims, either asserted or unasserted, that arise in the ordinary course of business. The Company records liabilities for contingencies including legal costs when it is probable that a liability has been incurred and when the amount can be reasonably estimated. Legal costs are expensed as incurred. Although the outcome of the various legal proceedings and claims cannot be predicted with certainty, management does not believe that any of these proceedings or other claims will have a material effect on the Company’s business, financial condition, results of operations or cash flows.

16. Segment Information

The Company has determined that it operates as one operating and reportable segment. The Company’s CODM reviews financial information on a consolidated basis, together with certain operating and performance measures principally to make decisions about how to allocate resources and measure performance.

107

Table of Contents

The Company has not disclosed certain geographic information pertaining to revenues and total assets as it is impracticable to disclose and is not utilized by the Company’s CODM to review operating results or make decisions about how to allocate resources.

17. Subsequent Events

On February 15, 2023, the Company granted 26 stock options and 162 restricted stock units to employees under the 2021 Equity Plan.

108

Table of Contents

SCHEDULE I—CONDENSED FINANCIAL INFORMATION OF REGISTRANT

DoubleVerify Holdings, Inc.

(Parent Company Only)

Condensed Statements of Balance Sheets

(In thousands)

As of December 31, 

(in thousands, except per share data)


2022


2021

Assets:

Current assets


Cash and cash equivalents

$

184,693

$

187,105

Total current assets


184,693


187,105

Investment in subsidiary


507,557


428,006

Due from subsidiaries


320,220


285,906

Total assets

$

1,012,470

$

901,017

Liabilities and Stockholder’s Equity:


Due to subsidiaries

$

135,396

$

101,896

Accrued expense


215


55

Total liabilities

$

135,611

$

101,951

Stockholders’ equity


Common stock, $0.001 par value, 1,000,000 shares authorized, 165,448 shares issued and 165,417 outstanding as of December 31, 2022; 1,000,000 shares authorized, 162,347 shares issued and 162,297 outstanding as of December 31, 2021


165


162

Additional paid‑in capital


756,299


717,228

Treasury stock, at cost, 31 shares and 50 shares as of December 31, 2022 and December 31, 2021, respectively


(796)


(1,802)

Retained earnings


127,517


84,249

Accumulated other comprehensive loss, net of income taxes


(6,326)


(771)

Total stockholders’ equity


876,859


799,066

Total liabilities and stockholders’ equity

$

1,012,470

$

901,017

See accompanying notes to condensed financial statements.

109

Table of Contents

SCHEDULE I—CONDENSED FINANCIAL INFORMATION OF REGISTRANT

DoubleVerify Holdings, Inc.

(Parent Company Only)

Condensed Statements of Operations and Comprehensive Income

(In thousands)

Year Ended December 31, 

(in thousands)


2022


2021


2020

Revenue

$

$

$

Cost of revenue


Product development


15,030


4,369


673

Sales, marketing and customer support


14,265


6,374


6,151

General and administrative


13,220


28,513


14,020

Loss from operations


(42,515)


(39,256)


(20,844)

Other (income) expense, net


(679)


996


Equity in pre‑tax earnings of consolidated subsidiaries


101,204


66,073


38,153

Income before income taxes


59,368


25,821


17,309

Income tax expense (benefit)


16,100


(3,487)


(3,144)

Net income


43,268


29,308


20,453

Foreign currency cumulative translation adjustment


(5,555)


(1,782)


1,078

Total comprehensive income

$

37,713

$

27,526

$

21,531

See accompanying notes to condensed financial statements.

110

Table of Contents

SCHEDULE I—CONDENSED FINANCIAL INFORMATION OF REGISTRANT

DoubleVerify Holdings, Inc.

(Parent Company Only)

Condensed Statements of Cash Flows

(In thousands)

Year Ended December 31, 

(in thousands)


2022


2021


2020

Operating activities:

$

32,394

$

67,294

$

18,214

Investing activities:

Transfer of funds to subsidiary


(32,099)


(179,825)


(83,000)

Net cash used in investing activities


(32,099)


(179,825)


(83,000)

Financing activities:


Repurchase of vested options


(15,506)

Proceeds from Series A preferred stock issuance, net of issuance costs


346,150

Payments to shareholders for preferred stock Series A


(260,686)

Proceeds from common stock issued upon exercise of stock options


5,803


12,440


780

Proceeds from common stock issued under employee purchase plan


1,734


404


424

Proceeds from issuance of common stock upon initial public offering

269,390

Proceeds from issuance of common stock in connection to concurrent private placement

30,000

Payments for offering costs

(17,214)

Shares repurchased for settlement of employee tax withholdings

(10,244)

(1,802)

Net cash (used in) provided by financing activities


(2,707)


293,218


71,162

Effect of exchange rate changes on cash and cash equivalents


Net (decrease) increase in cash and cash equivalents


(2,412)


180,687


6,376

Cash and cash equivalents—Beginning of period


187,105


6,418


42

Cash and cash equivalents—End of period

$

184,693

$

187,105

$

6,418

Noncash investing and financing transactions:


Common stock issued in connection with acquisition

22,526

Exchange of common stock for preferred stock

260,686

Treasury stock reissued upon the conversion of Series A preferred stock for common stock

260,686

Stock-based compensation included in capitalized software development costs

480

Due to consolidated subsidiaries

33,500

68,940

See accompanying notes to condensed financial statements

111

Table of Contents

SCHEDULE I—CONDENSED FINANCIAL INFORMATION OF REGISTRANT

DoubleVerify Holdings, Inc.

(Parent Company Only)

Notes to the Condensed Financial Statements

(In thousands)

1. Organization

DoubleVerify Holdings, Inc. (the “Company”) is a leading software platform for digital media measurement and analytics. Our mission is to create stronger, safer, more secure digital transactions that drive optimal outcomes for global advertisers. Through our software platform and the metrics it provides, we help preserve the fair value exchange between buyers and sellers of digital media. The Company’s solutions provide advertisers unbiased data analytics that enable advertisers to increase the effectiveness, quality and return on their digital advertising investments. The DV Authentic Ad is our proprietary metric of digital media quality, which measures whether a digital ad was delivered in a brand suitable environment, fully viewable, by a real person and in the intended geography. The Company’s software interface, DV Pinnacle, delivers these metrics to our customers in real time, allowing them to access critical performance data on their digital transactions. The Company’s software solutions are integrated across the entire digital advertising ecosystem, including programmatic platforms, social media channels and digital publishers. The Company’s solutions are accredited by the Media Rating Council, which allows the Company’s data to be used as a single source standard in the evaluation and measurement of digital ads.

The Company was incorporated on August 16, 2017, is registered in the state of Delaware and is the parent company of DoubleVerify Midco, Inc. (“MidCo”), which is in turn the parent company of DoubleVerify Inc. On August 18, 2017, DoubleVerify Inc. entered into an agreement and plan of merger (the “Agreement”), whereby the Company and Pixel Merger Sub, Inc. (“Merger Sub”), a wholly-owned subsidiary of the Company, agreed to provide for the merger of the Merger Sub with DoubleVerify Inc. pursuant to the terms and conditions of the Agreement.

On the effective date, Merger Sub was merged with and into DoubleVerify Inc. whereupon the separate corporate existence of Merger Sub ceased and DoubleVerify Inc. continued as the surviving corporation.

Through the merger, the Company acquired 100% of the outstanding equity instruments of DoubleVerify Inc., (the “Acquisition”) resulting in a change of control at the parent level. The merger resulted in the application of acquisition accounting under the provisions of Financial Accounting Standards Board (“FASB”) Topic Accounting Standards Codification (“ASC”) 805, “Business Combinations.”

The Company is a holding company that does not conduct any business operations of its own and therefore its assets consist primarily of investments in subsidiaries and cash proceeds from stock option exercises, in accordance with the Company’s stock plan discussed further in Footnote 2, Basis of Presentation and Summary of Significant Accounting Policies, to the Company’s Consolidated Financial Statements. The amounts available to the Company to fulfill cash commitments or to pay cash dividends are also subject to the covenants and distribution restrictions in its subsidiaries’ loan agreements.

2. Basis of Preparation

The accompanying condensed parent company-only financial statements are required in accordance with Rule 5-04 of Regulation S-X. These condensed financial statements have been presented on a standalone basis for the Company and have been prepared in conformity with accounting principles generally accepted in the United States of America (“GAAP”). The Company’s financial statements should be read in conjunction with the Company’s annual Consolidated Financial Statements.

112

Table of Contents

On March 29, 2021, the Company effected a 1 for 3 reverse stock split (“reverse stock split”) of its outstanding common stock and a proportional adjustment to the existing conversion ratio for the preferred stock described in Footnote 14, Stockholders’ Equity to the Company’s annual Consolidated Financial Statements. Accordingly, all share and per share amounts for all periods presented in these consolidated financial statements and notes thereto, have been adjusted retrospectively, where applicable, to reflect this reverse stock split.

3. Income Taxes

The income tax provision of $16.1 million, tax benefit of $3.5 million, and tax benefit of $3.1 million for years ended December 31, 2022, 2021 and 2020, respectively, represent the Company’s consolidated income tax expense (benefit) as it relates to the Company’s subsidiaries, which have not been consolidated for this presentation.

4. Distributions

There were no distributions made to DoubleVerify Holdings, Inc. by its subsidiaries, for the years ended December 31, 2022, 2021 and 2020.

5. Long-term debt and credit facilities

As of December 31, 2022 and 2021, DoubleVerify Holdings, Inc. held no debt. Certain subsidiaries of the Company are subject to debt agreements.

For further discussion on the nature and terms of these agreements, refer to Footnote 9, Long-term Debt, to the Company’s Consolidated Financial Statements.

6. Commitments and Contingencies

For a discussion of commitments and contingencies, refer to Footnote 15, Commitments and Contingencies, to the Company’s Consolidated Financial Statements.

113

Table of Contents

SCHEDULE II

DoubleVerify Holdings, Inc.

Valuation and Qualifying Accounts

(In thousands)

Balance at

Charges

(Deductions)

Balance at 

 Beginning of

(Recoveries) to Costs

Additions

End of

Description


 Year


and Expenses


Write off


 Year

Allowance for doubtful accounts


Year ended December 31, 2022


$

6,527


$

5,033


$

(2,667)


$

8,893

Year ended December 31, 2021


$

7,049


$

(711)


$

189


$

6,527

Year ended December 31, 2020


$

4,599


$

4,811


$

(2,361)


$

7,049

114

Table of Contents

Item 9. Changes in and Disagreements with Accountants on Accounting and Financial Disclosure

None.

Item 9A. Controls and Procedures

Evaluation of Disclosure Controls and Procedures

Our management, with the participation of our Chief Executive Officer and Chief Financial Officer, evaluated the effectiveness of our disclosure controls and procedures as defined in Rule 13a-15(e) under the Exchange Act, as of December 31, 2022. Based on this evaluation, our Chief Executive Officer and Chief Financial Officer concluded that as of December 31, 2022, our disclosure controls and procedures were effective to provide reasonable assurance that information required to be disclosed in the reports we file and submit under the Exchange Act is recorded, processed, summarized, and reported as and when required, and that such information is accumulated and communicated to our management, including our Chief Executive Officer and Chief Financial Officer, to allow timely decisions regarding its required disclosure.

Management’s Report on Internal Control Over Financial Reporting

Our management is responsible for establishing and maintaining adequate internal control over financial reporting, as defined in Rules 13a-15(f) and 15d-15(f) under the Exchange Act. Management conducted an assessment of the effectiveness of our internal control over financial reporting based on the criteria set forth in Internal Control – Integrated Framework issued by the Committee of Sponsoring Organizations of the Treadway Commission (2013 framework). Based on this evaluation, management has concluded that our internal control over financial reporting was effective as of December 31, 2022 to provide reasonable assurance regarding the reliability of financial reporting and the preparation of the financial statements in accordance with U.S. GAAP. The effectiveness of our internal control over financial reporting as of December 31, 2022 has been audited by Deloitte & Touche LLP, an independent registered public accounting firm, as stated in their report, which appears in Item 8 of this Form 10-K.

Changes in Internal Control over Financial Reporting

There were no changes in our internal control over financial reporting that occurred during the quarter ended December 31, 2022 that have materially affected, or are reasonably likely to materially affect, our internal control over financial reporting.

Inherent Limitations on Effectiveness of Controls

Management recognizes that a control system, no matter how well conceived and operated, can provide only reasonable, not absolute, assurance that the objectives of the control system are met. Further, the design of a control system must reflect the fact that there are resource constraints, and the benefits of controls must be considered relative to their costs. Because of the inherent limitations in all control systems, no evaluation of controls can provide absolute assurance that all control issues and instances of fraud or error, if any, have been detected. These inherent limitations include the realities that judgments in decision making can be faulty, and that breakdowns can occur because of a simple error or mistake. Additionally, controls can be circumvented by the individual acts of some persons, by collusion of two or more people, or by management override of the controls. The design of any system of controls also is based in part upon certain assumptions about the likelihood of future events, and there can be no assurance that any design will succeed in achieving its stated goals under all potential future conditions; over time, controls may become inadequate because of changes in conditions, or the degree of compliance with policies or procedures may deteriorate. Because of the inherent limitations in a cost-effective control system, misstatements due to error or fraud may occur and not be detected.

Item 9B. Other Information

None.

115

Table of Contents

Item 9C. Disclosure Regarding Foreign Jurisdictions that Prevent Inspections

None.

116

Table of Contents

PART III

Item 10. Directors, Executive Officers and Corporate Governance

The information required by this item will be included in our proxy statement relating to our 2023 annual meeting of stockholders to be filed by us with the SEC no later than 120 days after the close of our fiscal year ended December 31, 2022 (the "Proxy Statement") and is incorporated herein by reference.

Item 11. Executive Compensation

The information required by this item will be included in the Proxy Statement and is incorporated herein by reference.

Item 12. Security Ownership of Certain Beneficial Owners and Management and Related Stockholder Matters

The information required by this item will be included in the Proxy Statement and is incorporated herein by reference.

Item 13. Certain Relationships and Related Transactions, and Director Independence

The information required by this item will be included in the Proxy Statement and is incorporated herein by reference.

Item 14. Principal Accountant Fees and Services

The information required by this item will be included in the Proxy Statement and is incorporated herein by reference.

117

Table of Contents

PART IV

Item 15. Exhibits and Financial Statement Schedules

(a) We have filed the following documents as part of this Annual Report on Form 10-K:

1. Consolidated Financial Statements

See Index to Consolidated Financial Statements in Part II, Item 8 herein.

2. Financial Statement Schedules

See Schedule I – Condensed Financial Information of Registrant and Schedule II – Valuation and Qualifying Accounts herein.

3. Exhibits

Except as otherwise noted below, the exhibits listed below in the accompanying “Index to Exhibits” are filed or incorporated by reference as part of this Annual Report on Form 10-K.

INDEX TO EXHIBITS

Exhibit
Number


Description


Form


File No.


Exhibit


Filing Date

3.1

Second Amended and Restated Certificate of Incorporation, dated April 23, 2021

8-K

001-40349

3.1

April 26, 2021

3.2

Amended and Restated Bylaws, currently in effect

8-K

001-40349

3.2

April 26, 2021

4.1

Description of Securities

10-K

001-40349

4.1

March 8, 2022

4.2

Form of Common Stock Certificate

S-1/A

333-254380

4.1

April 12, 2021

10.1

Amendment and Restatement Agreement, dated as of October 1, 2020, by and among DoubleVerify Inc., as borrower, DoubleVerify MidCo, Inc., as guarantor, the banks and other financial institutions party thereto, as lenders, and Capital One, National Association, as administrative agent, letter of credit issuer and swing lender, and others

S-1

333-254380

10.1

March 17, 2021

10.2#

Employment Agreement with Nicola Allais, dated October 25, 2017

S-1

333-254380

10.2

March 17, 2021

10.3#

Employment Agreement with Matthew McLaughlin, dated December 31, 2020

S-1

333-254380

10.3

March 17, 2021

10.4#

Employment Agreement with Andy Grimmig, dated March 23, 2020

S-1

333-254380

10.4

March 17, 2021

10.5#

Employment Agreement with Mark Zagorski, dated July 1, 2020

S-1

333-254380

10.5

March 17, 2021

10.6#

Employment Agreement with Julie Eddleman, dated January 26, 2021

S-1

333-254380

10.7

March 17, 2021

118

Table of Contents

Exhibit
Number


Description


Form


File No.


Exhibit


Filing Date

10.7#

Form of Director Indemnification Agreement

S-1/A

333-254380

10.8

April 12, 2021

10.8#

2017 Omnibus Equity Incentive Plan

S-1

333-254380

10.9

March 17, 2021

10.9#

Form of Nonqualified Stock Option Award Agreement under the 2017 Omnibus Equity Incentive Plan for Executives

S-1

333-254380

10.10

March 17, 2021

10.10#

Form of Restricted Stock Unit Award Agreement under the 2017 Omnibus Equity Incentive Plan for Executives

S-1

333-254380

10.11

March 17, 2021

10.11#

Form of Restricted Stock Unit Award Agreement under the 2017 Omnibus Equity Incentive Plan for Directors

S-1

333-254380

10.12

March 17, 2021

10.12#

Nonqualified Stock Option Award Agreement between DoubleVerify Holdings, Inc. and Mark Zagorski under the 2017 Omnibus Equity Incentive Plan, dated July 28, 2020

S-1

333-254380

10.13

March 17, 2021

10.13#

Nonqualified Stock Option Award Agreement between Pixel Group Holdings Inc. and Laura Desmond under the 2017 Omnibus Equity Incentive Plan, dated September 20, 2017

S-1

333-254380

10.14

March 17, 2021

10.14#

Restricted Stock Unit Award Agreement (Upfront Time RSUs) between DoubleVerify Holdings, Inc. and Mark Zagorski under the 2017 Omnibus Equity Incentive Plan, dated July 28, 2020

S-1

333-254380

10.15

March 17, 2021

10.15#

Restricted Stock Unit Award Agreement between DoubleVerify Holdings, Inc. and Julie Eddleman under the 2017 Omnibus Equity Incentive Plan, dated January 26, 2021

S-1

333-254380

10.18

March 17, 2021

10.16#

2021 Omnibus Equity Incentive Plan

S-8

333-255374

4.3

April 20, 2021

10.17#

2021 Employee Stock Purchase Plan

S-8

333-255374

4.4

April 20, 2021

10.18

Registration Rights Agreement by and among DoubleVerify Holdings, Inc., Providence VII U.S. Holdings L.P. and the other stockholders of DoubleVerify Holdings, Inc. listed on Schedule I thereto, dated as of April 19, 2021

8-K

001-40349

10.1

April 26, 2021

10.19

Stockholder’s Agreement, by and between DoubleVerify Holdings, Inc. and Providence VII U.S. Holdings L.P., dated as of April 20, 2021

8-K

001-40349

10.2

April 26, 2021

119

Table of Contents

Exhibit
Number


Description


Form


File No.


Exhibit


Filing Date

10.20

Common Stock Purchase Agreement by and among DoubleVerify Holdings, Inc. and Tiger Global Investments, L.P., dated as of April 9, 2021

S-1/A

333-254380

10.24

April 12, 2021

10.21#

Executive Transition and Separation Agreement, by and among Matthew McLaughlin, DoubleVerify Inc. and DoubleVerify Holdings, Inc., dated January 14, 2022

8-K

001-40349

10.1

January 19, 2022

10.22#

Form of Nonqualified Stock Option Award Agreement under the 2021 Omnibus Equity Incentive Plan (full acceleration upon change of control)

10-K

001-40349

10.22

March 8, 2022

10.23#

Form of Restricted Stock Unit Award Agreement under the 2021 Omnibus Equity Incentive Plan (full acceleration upon change of control)

10-K

001-40349

10.23

March 8, 2022

10.24#

DoubleVerify Holdings, Inc. Deferred Compensation Plan

10-K

001-40349

10.24

March 8, 2022

10.25†#

Form of Nonqualified Stock Option Award Agreement under the 2021 Omnibus Equity Incentive Plan (double trigger protection upon change of control)**

10.26†#

Form of Restricted Stock Unit Award Agreement under the 2021 Omnibus Equity Incentive Plan (double trigger protection upon change of control)**

21.1†

List of Subsidiaries

23.1†

Consent of Deloitte & Touche LLP

24.1†

Power of Attorney (contained on signature page)

31.1†

Certification of Chief Executive Officer pursuant to Rule 13a-14(a) and Rule 15d-14(a) of the Exchange Act, as adopted pursuant to Section 302 of the Sarbanes-Oxley Act of 2002

31.2†

Certification of Chief Financial Officer pursuant to Rule 13a-14(a) and Rule 15d-14(a) of the Exchange Act, as adopted pursuant to Section 302 of the Sarbanes-Oxley Act of 2002

32.1†*

Certification of Chief Executive Officer pursuant to 18 U.S.C. Section 1350, as adopted pursuant to Section 906 of the Sarbanes-Oxley Act of 2002.

32.2†*

Certification of Chief Financial Officer pursuant to 18 U.S.C. Section 1350, as adopted pursuant to Section 906 of the Sarbanes-Oxley Act of 2002.

120

Table of Contents

Exhibit
Number


Description


Form


File No.


Exhibit


Filing Date

101.INS†

XBRL Instance Document – the instance document does not appear in the Interactive Data File because its XBRL tags are embedded within the Inline XBRL document

101.SCH†

XBRL Taxonomy Extension Schema Document

101.CAL†

XBRL Taxonomy Extension Calculation Linkbase Document

101.DEF†

XBRL Taxonomy Extension Definition Linkbase Document

101.LAB†

XBRL Taxonomy Extension Label Linkbase Document

101.PRE†

XBRL Taxonomy Extension Presentation Linkbase Document

104†

Cover Page Interactive Data File (formatted in Inline XBRL and contained in Exhibit 101)

Filed herewith.

*Pursuant to SEC Release No. 33-8212, this certification will be treated as “accompanying” this Annual Report and not “filed” as part of such report for purposes of Section 18 of the Exchange Act, or otherwise subject to the liability of Section 18 of the Exchange Act, and this certification will not be deemed to be incorporated by reference into any filing under the Securities Act, except to the extent that the registrant specifically incorporates it by reference.

**Exhibits omitted pursuant to Item 601(a)(5) of Regulation S-K. Copies of any omitted exhibit will be furnished to the SEC upon request.

#Identifies each management contract or compensatory plan or arrangement.

Item 16. Form 10-K Summary

None.

121

Table of Contents

SIGNATURES

Pursuant to the requirements of Section 13 or 15(d) of the Securities Exchange Act of 1934, the registrant has duly caused this report to be signed on its behalf by the undersigned, thereunto duly authorized.

Dated: March 1, 2023

DOUBLEVERIFY HOLDINGS, INC.

By:

/s/ MARK ZAGORSKI

Name:

Mark Zagorski

Title:

Chief Executive Officer and Director

POWER OF ATTORNEY

KNOW ALL PERSONS BY THESE PRESENTS, that each person whose signature appears below hereby constitutes and appoints Mark Zagorski and Nicola Allais, and each of them, his or her true and lawful attorney-in-fact and agent, acting alone, with full power of substitution and resubstitution, for him or her and in his or her name, place and stead, in any and all capacities, to sign any or all amendments to this report, and to file the same, with all exhibits thereto and other documents in connection therewith, with the U.S. Securities and Exchange Commission, granting unto said attorney-in-fact full power and authority to do and perform each and every act and thing requisite or necessary to be done in and about the premises, as such person, hereby ratifying and confirming all that said attorney-in-fact and agent, or his or her substitute or substitutes, may lawfully do or cause to be done by virtue hereof

.

Pursuant to the requirements of the Securities Exchange Act of 1934, this report has been signed by the following persons in the capacities and on the dates indicated.

Signature

Title

Date

/s/ MARK ZAGORSKI

Mark Zagorski

Chief Executive Officer and Director (Principal Executive Officer)

March 1, 2023

/s/ NICOLA ALLAIS

Nicola Allais

Chief Financial Officer
(Principal Financial Officer and Principal Accounting Officer)

March 1, 2023

/s/ LAURA B. DESMOND

Laura B. Desmond

Director

March 1, 2023

/s/ R. DAVIS NOELL

R. Davis Noell

Director

March 1, 2023

/s/ LUCY STAMELL DOBRIN

Lucy Stamell Dobrin

Director

March 1, 2023

/s/ JOSHUA L. SELIP

Joshua L. Selip

Director

March 1, 2023

/s/ TERI L. LIST

Teri L. List

Director

March 1, 2023

122

Table of Contents

/s/ KELLI TURNER

Kelli Turner

Director

March 1, 2023

/s/ ROSIE PEREZ

Director

March 1, 2023

Rosie Perez

/s/ SCOTT WAGNER

Director

March 1, 2023

Scott Wagner

/s/ SUNDEEP JAIN

Director

March 1, 2023

Sundeep Jain

123